Log Streams
Log Streams continuously ship organisation audit logs and secret events from Phase to an external log management platform or SIEM for monitoring, alerting and threat detection. Streams are configured under Integrations → Log Streams, deliver in near real-time, and expose a per-delivery history with manual retry for anything that fails. Log Streams are available on the Enterprise tier.
Log Streams ship metadata only. Secret values, keys and comments are end-to-end encrypted and never leave Phase.
How it works
- Phase pushes events to your destination — no inbound access, agents or polling required. A background engine sweeps every 30 seconds and ships new events in ordered chunks.
- Delivery is at-least-once: a stream's position (cursor) only advances after the destination accepts a chunk, or after a failed chunk's exact range is durably recorded as re-shippable — so a transient failure can never silently lose an event, but an event can occasionally be delivered twice. Deduplicate on
event.id, a stable UUID that is identical across redeliveries. - Each stream selects its own event sources and destination credentials. You can run multiple streams side by side — each keeps independent cursors, so they never interfere.
- Streams are ship-forward only: a new stream begins delivering from the moment it is created and does not backfill older events. This is a destination-side restriction — log platforms cap how far in the past an ingested event's timestamp may be (Datadog silently discards anything older than 18 hours, even when the request is accepted), so backfilling meaningful history over the live intake isn't possible. A dedicated export feature for historical logs — archiving to S3 in a format compatible with Datadog Log Rehydration — is coming in a future release.
- Changes to streams (create, update, pause, resume, delete, retries) are recorded in the organisation audit log under Logs → Log Streams — and, like any other audit event, they export through the stream itself.
Requirements
- A Phase organisation on the Enterprise tier, or a self-hosted instance with an activated license.
- The
LogStreamspermission in your organisation role, plus global access — streams export activity across the whole organisation (Owner and Admin roles qualify by default).
Event sources
- Organisation audit events: organisation-level activity — apps, environments, members, roles, service accounts, tokens, network policies and teams.
- Secret events: create, read, update and delete events for secrets across all apps.
Exported events
Every event is a structured JSON envelope (schema_version: 1) aligned with OpenTelemetry semantic conventions. event.category is secrets or org_audit; event.type is one of create, read, update, delete or access. The actor block identifies who acted (a user, service_account with its token, service_token for historical events from a legacy service token, or phase for system actions), and phase.description carries a human-readable summary of every event.
Secret events carry a phase.secret block (id, path, version, type — never the name or value). Organisation audit events instead carry a phase.resource block with a readable type slug (e.g. app, environment, member, invite, role, service_account_token, rotating_secret, network_access_policy, log_stream), the resource id and metadata, plus old_values / new_values for changes.
The example below is shown as it lands in Datadog: the usr, network, http, ddsource, service and ddtags fields are Datadog standard-attribute remappings of the neutral envelope's user, client and user_agent blocks, added by the Datadog adapter at delivery time.
{
  "schema_version": 1,
  "event": { "id": "…", "category": "secrets", "type": "read" },
  "timestamp": "2026-07-30T12:00:00+00:00",
  "actor": { "type": "service_account", "id": "…", "name": "ci-deploy", "token": { "name": "gh-actions" } },
  "usr": { "id": "…", "name": "Dev Eloper", "email": "dev@example.com" },
  "network": { "client": { "ip": "203.0.113.7" } },
  "http": { "useragent": "phase-cli/1.18" },
  "phase": {
    "organisation": { "id": "…", "name": "acme" },
    "app": { "id": "…", "name": "backend" },
    "environment": { "id": "…", "name": "Production", "type": "PROD" },
    "secret": { "id": "…", "path": "/api/payments", "version": 3, "type": "SECRET" },
    "description": "Secret read in backend / Production by ci-deploy"
  },
  "ddsource": "phase",
  "service": "phase-console",
  "ddtags": "phase_org:acme,phase_stream:datadog-prod"
}
To pivot from an exported secret event back to Phase, copy the phase.secret.id and paste it into the Console's global search (⌘K) — it resolves directly to the secret's app, environment and path.
Delivery guarantees
- At-least-once delivery. Events ship in ordered chunks (up to 500 per request), and a stream's cursor only advances after the destination accepts the chunk, or after a failed chunk's exact range is recorded as a re-shippable failure — a transient failure can therefore never silently lose an event, but one can occasionally be delivered twice (for example, if a network timeout hides a successful ingestion). Deduplicate on
event.id. - Near real-time. Streams are swept every 30 seconds; a healthy stream delivers new events within about a minute.
- Ordering. Events ship in
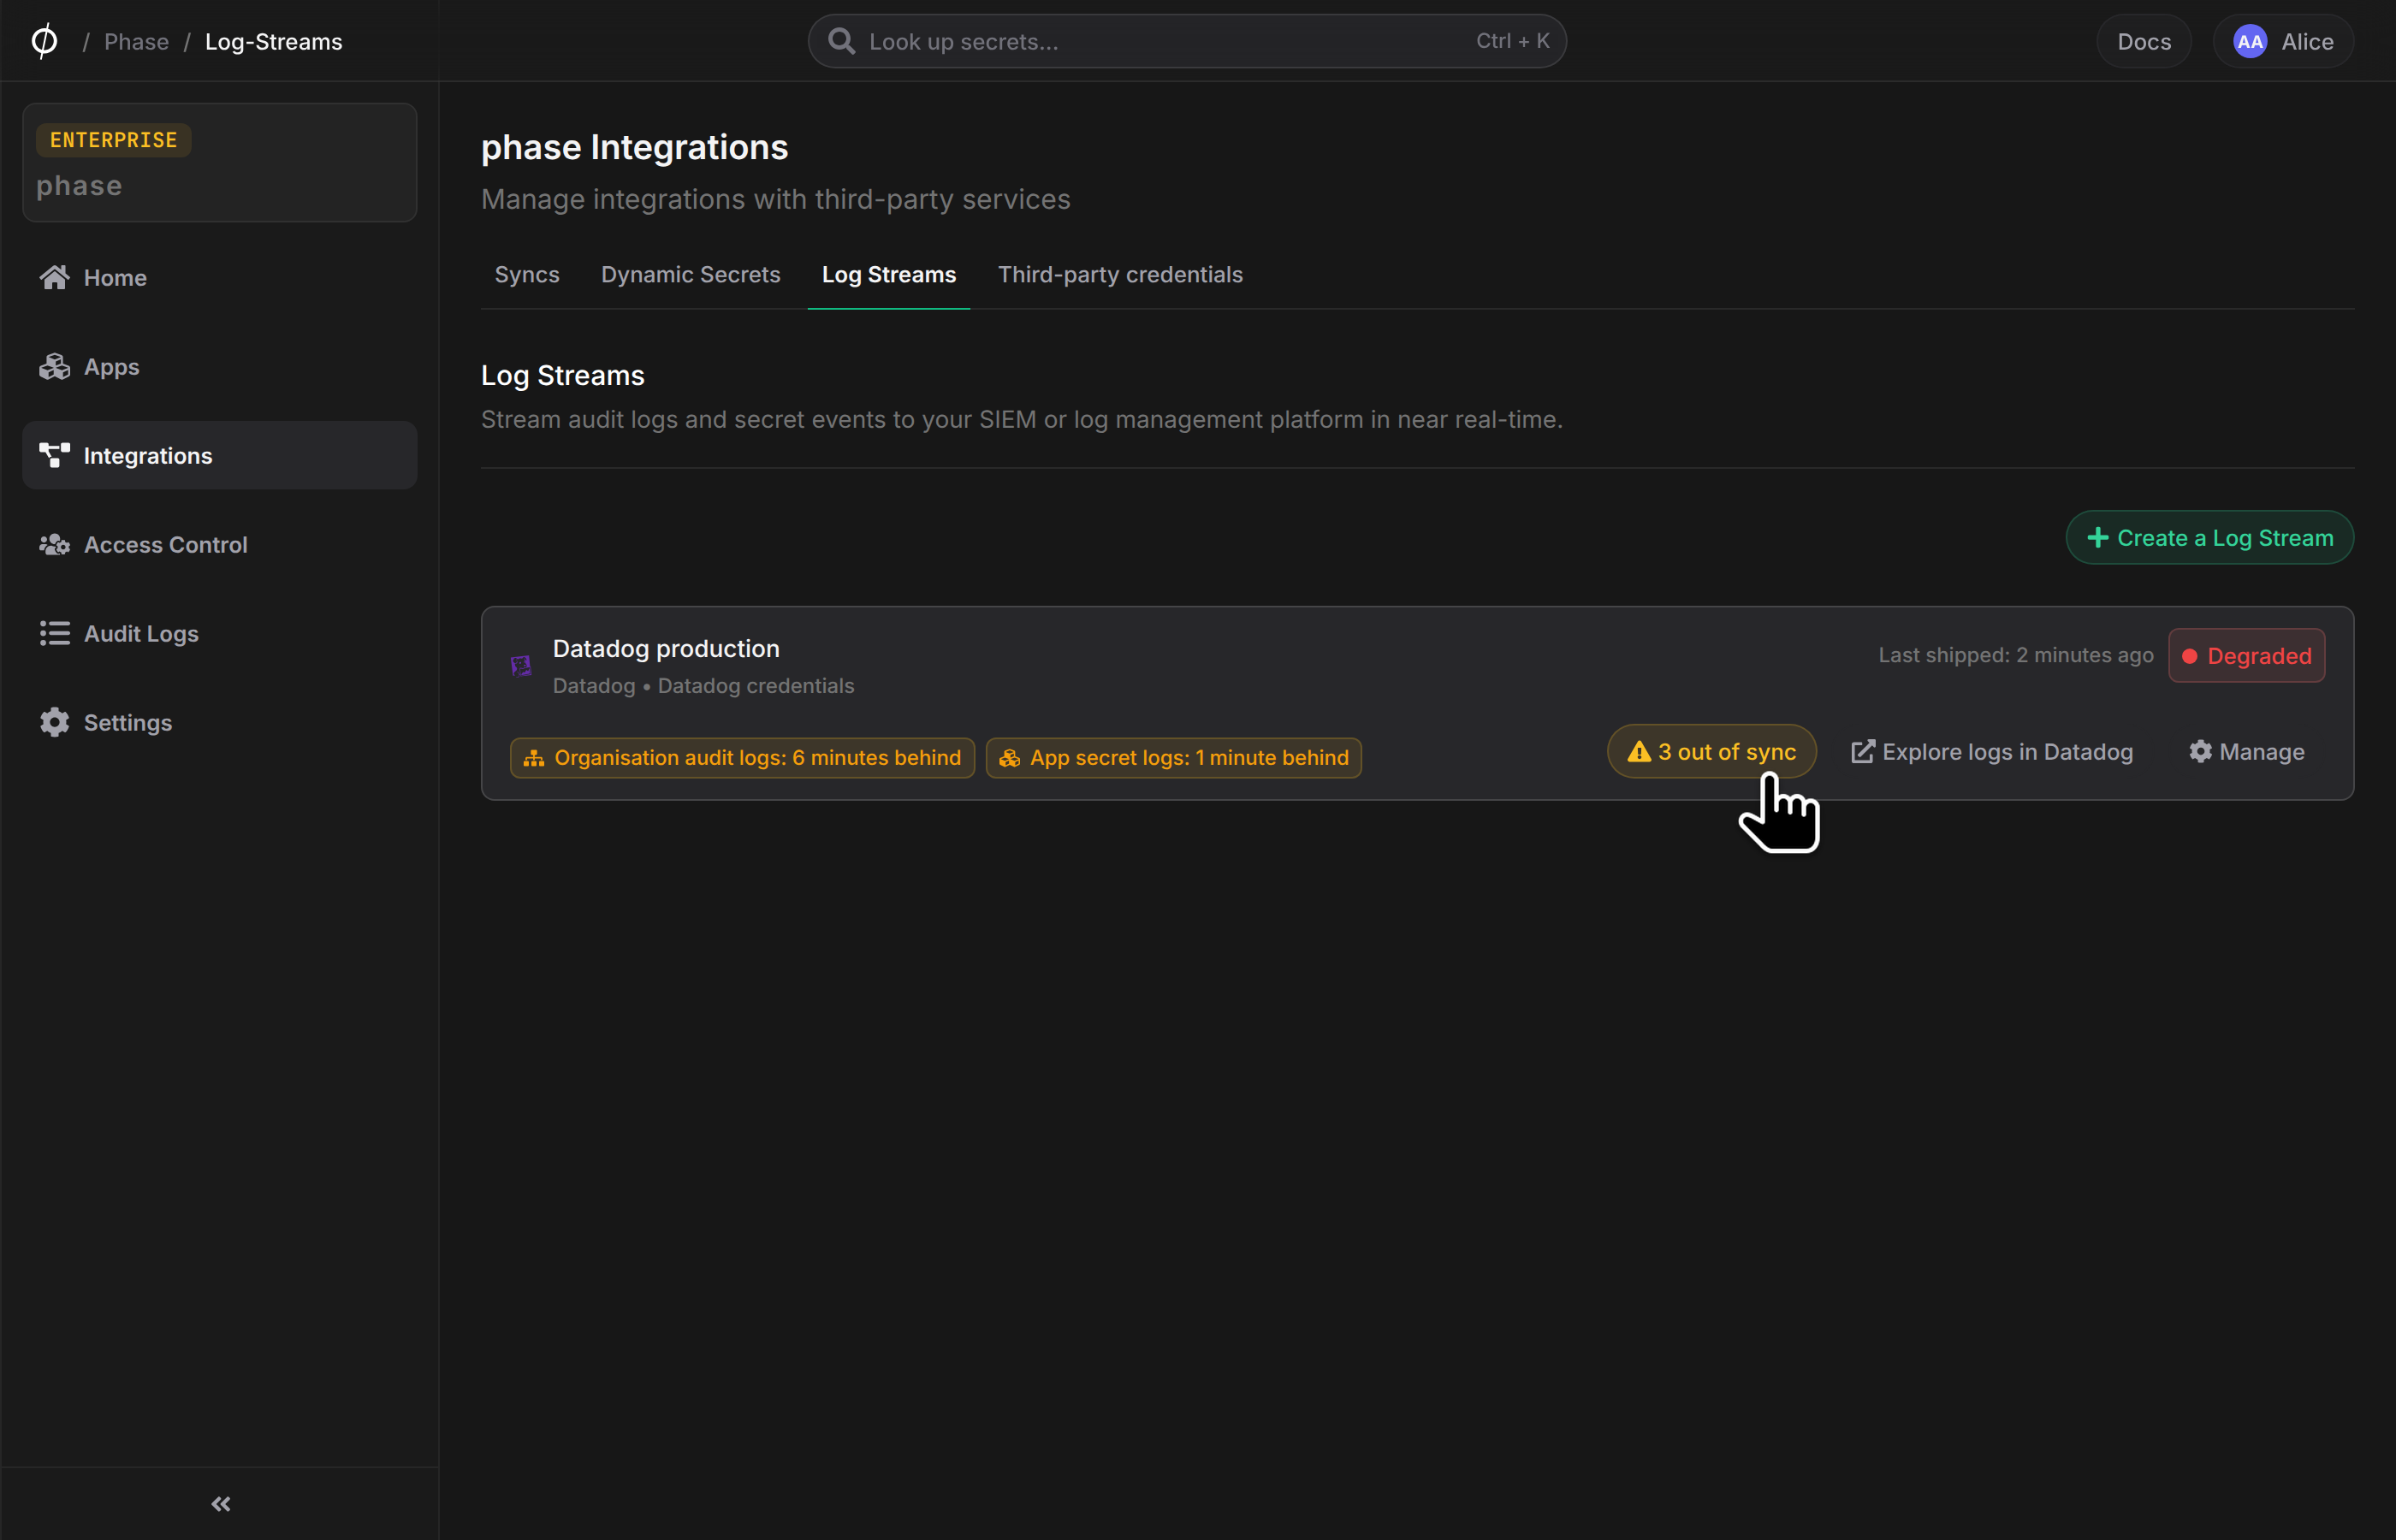
(timestamp, id)order per source. Manual re-ships of failed ranges arrive later than newer events — order by the event's owntimestampin queries, not ingestion time. - Delivery status. Each stream shows a per-source delivery delay ("Up to date", "26 minutes behind" — the age of the oldest event still waiting to ship). A Delayed status means events are queued but deliveries are running late; on self-hosted instances, persistent delay usually means the worker service is down or the pool needs more capacity (see Self-hosting).
When a delivery fails
-
The chunk is retried with exponential backoff, honouring the destination's
Retry-After, up to the stream's configured retry attempts (1–10, default 5). -
If retries are exhausted, the chunk is recorded as failed with its exact event time range, the stream is marked degraded, and shipping continues with newer events — one bad chunk never blocks the stream.
-
If a later successful delivery covers a failed range (for example after an authentication recovery), the failure is auto-resolved.
-
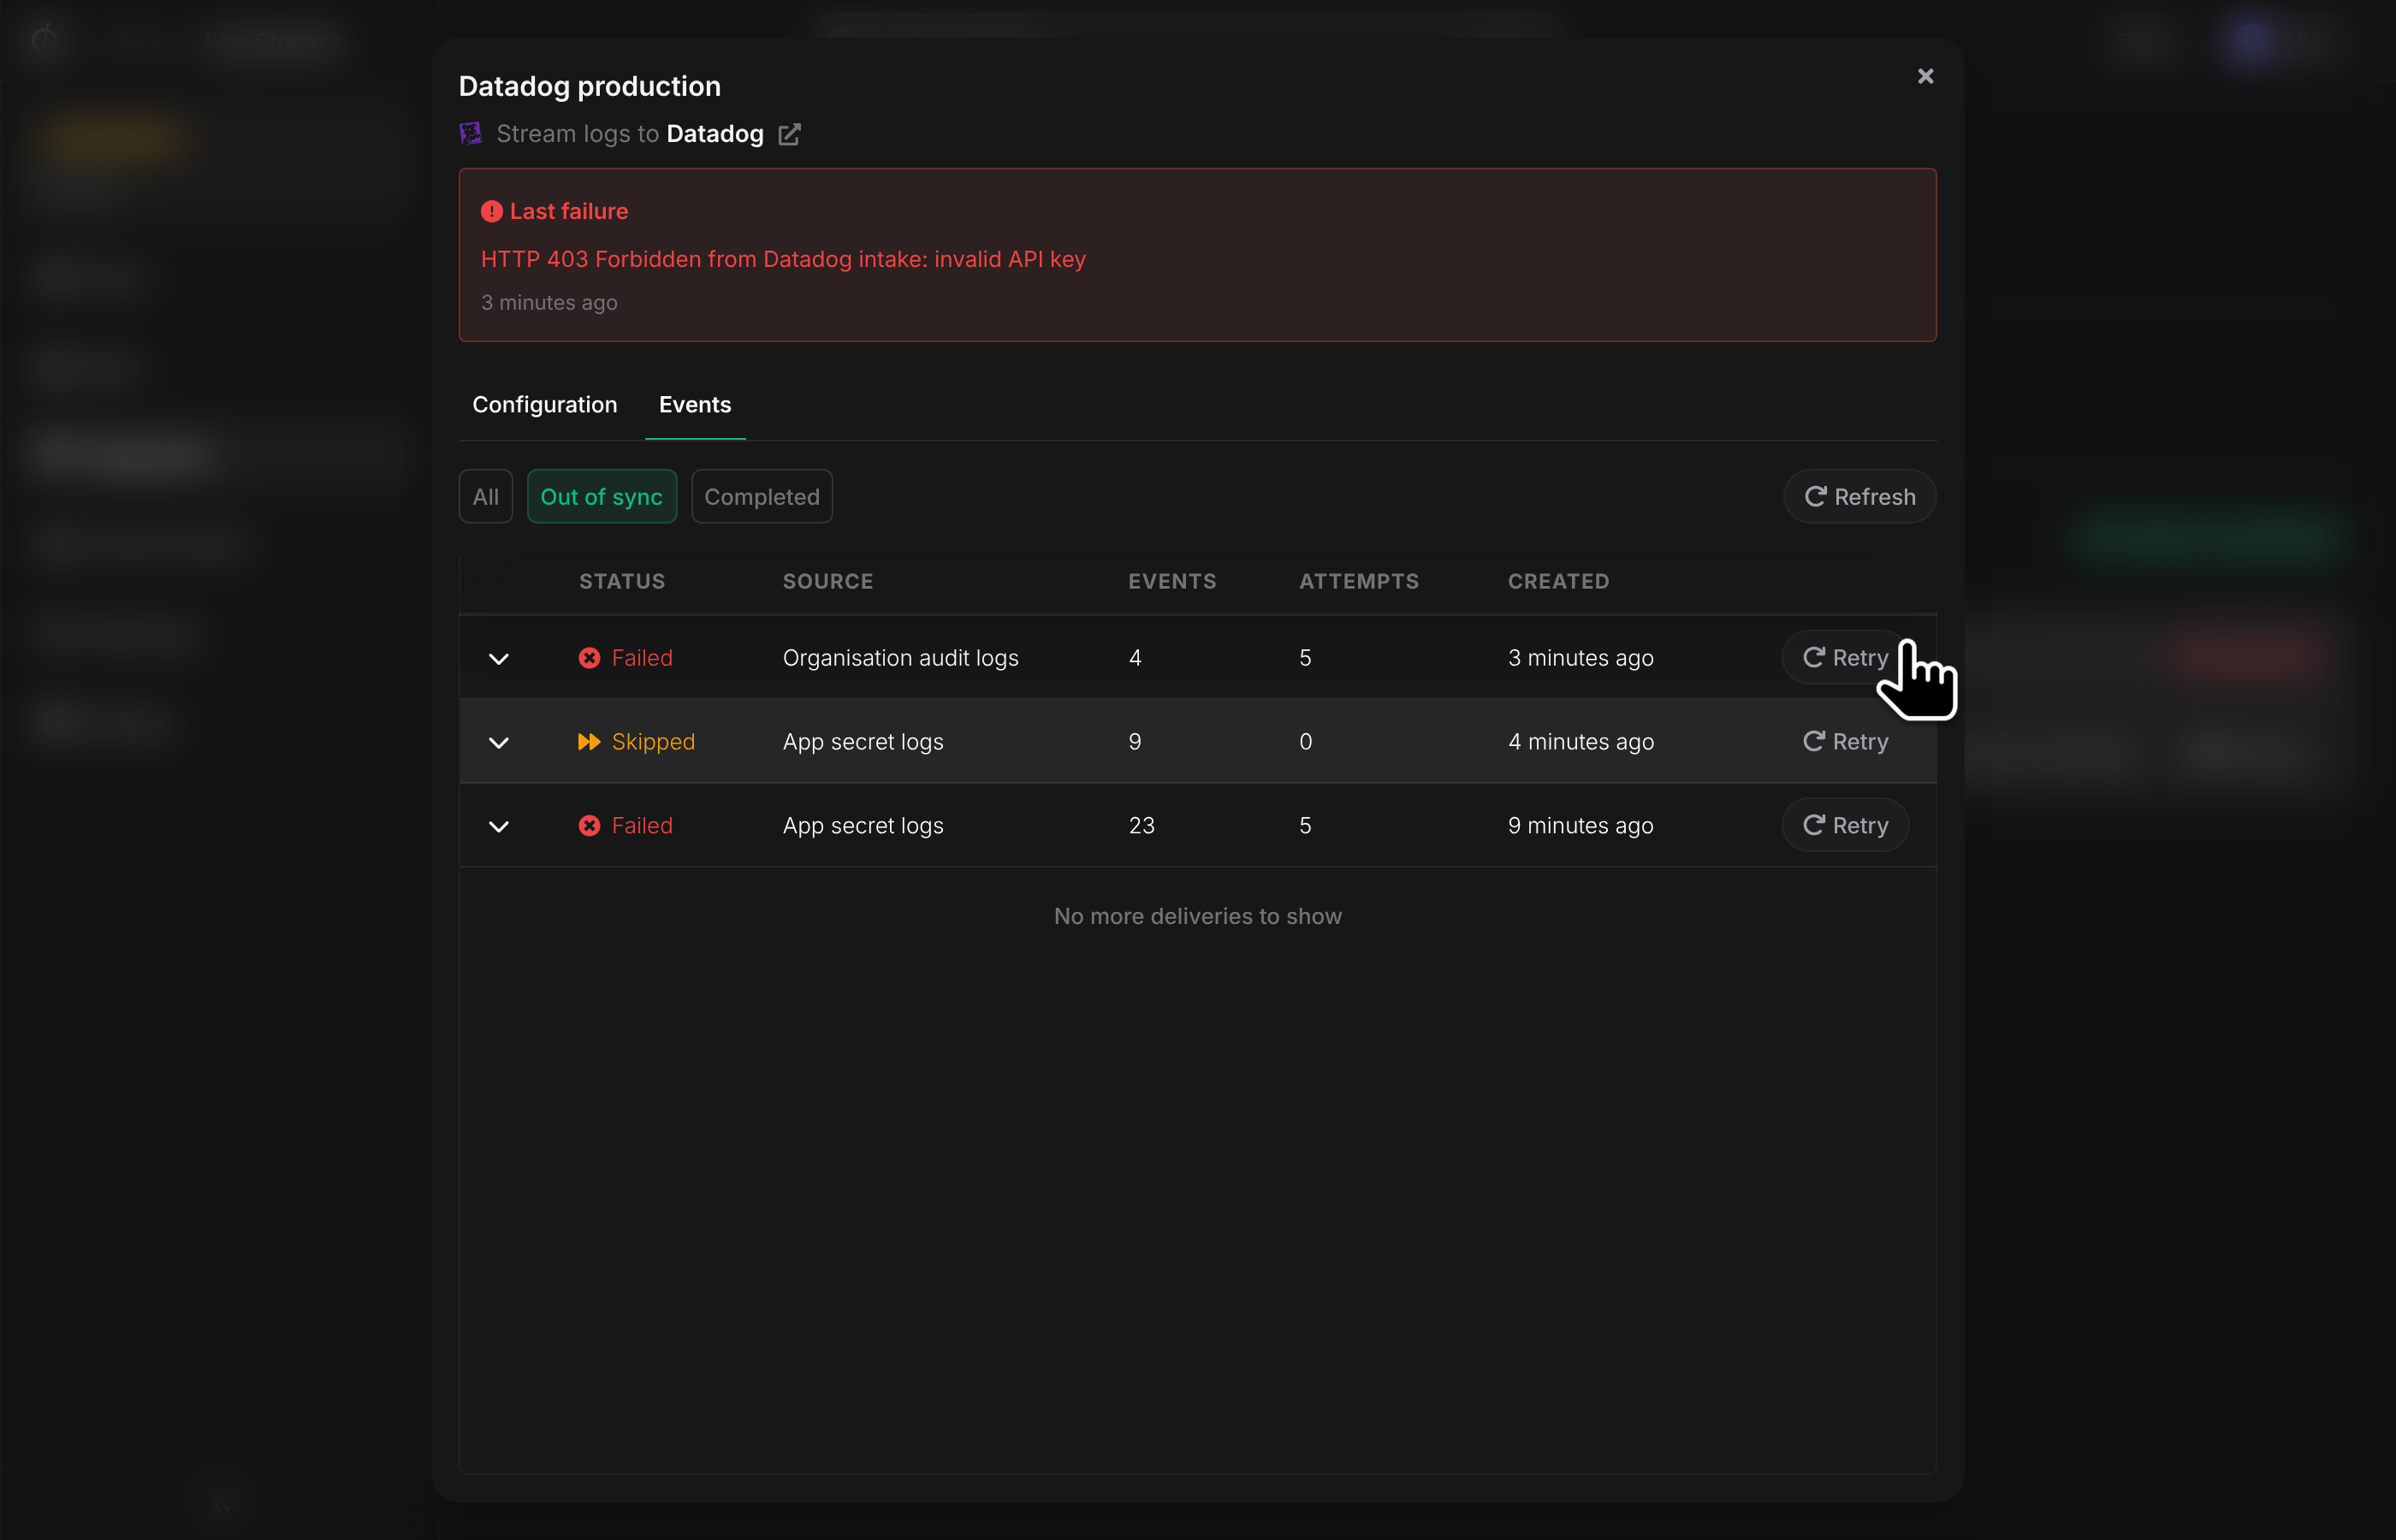
Anything still unresolved appears under the out of sync badge on the stream card. Click through to the filtered event history and press Retry on a row to re-ship exactly that range. Once a range falls fully outside the destination's ingestion window, the retry is refused — the destination would accept and silently discard the events, falsely marking the range recovered. Expired rows are auto-resolved as Expired after a grace period, and the events remain queryable in the Console. If only the older part of a range has expired, a retry ships the still-live tail and records the expired part as skipped.
-
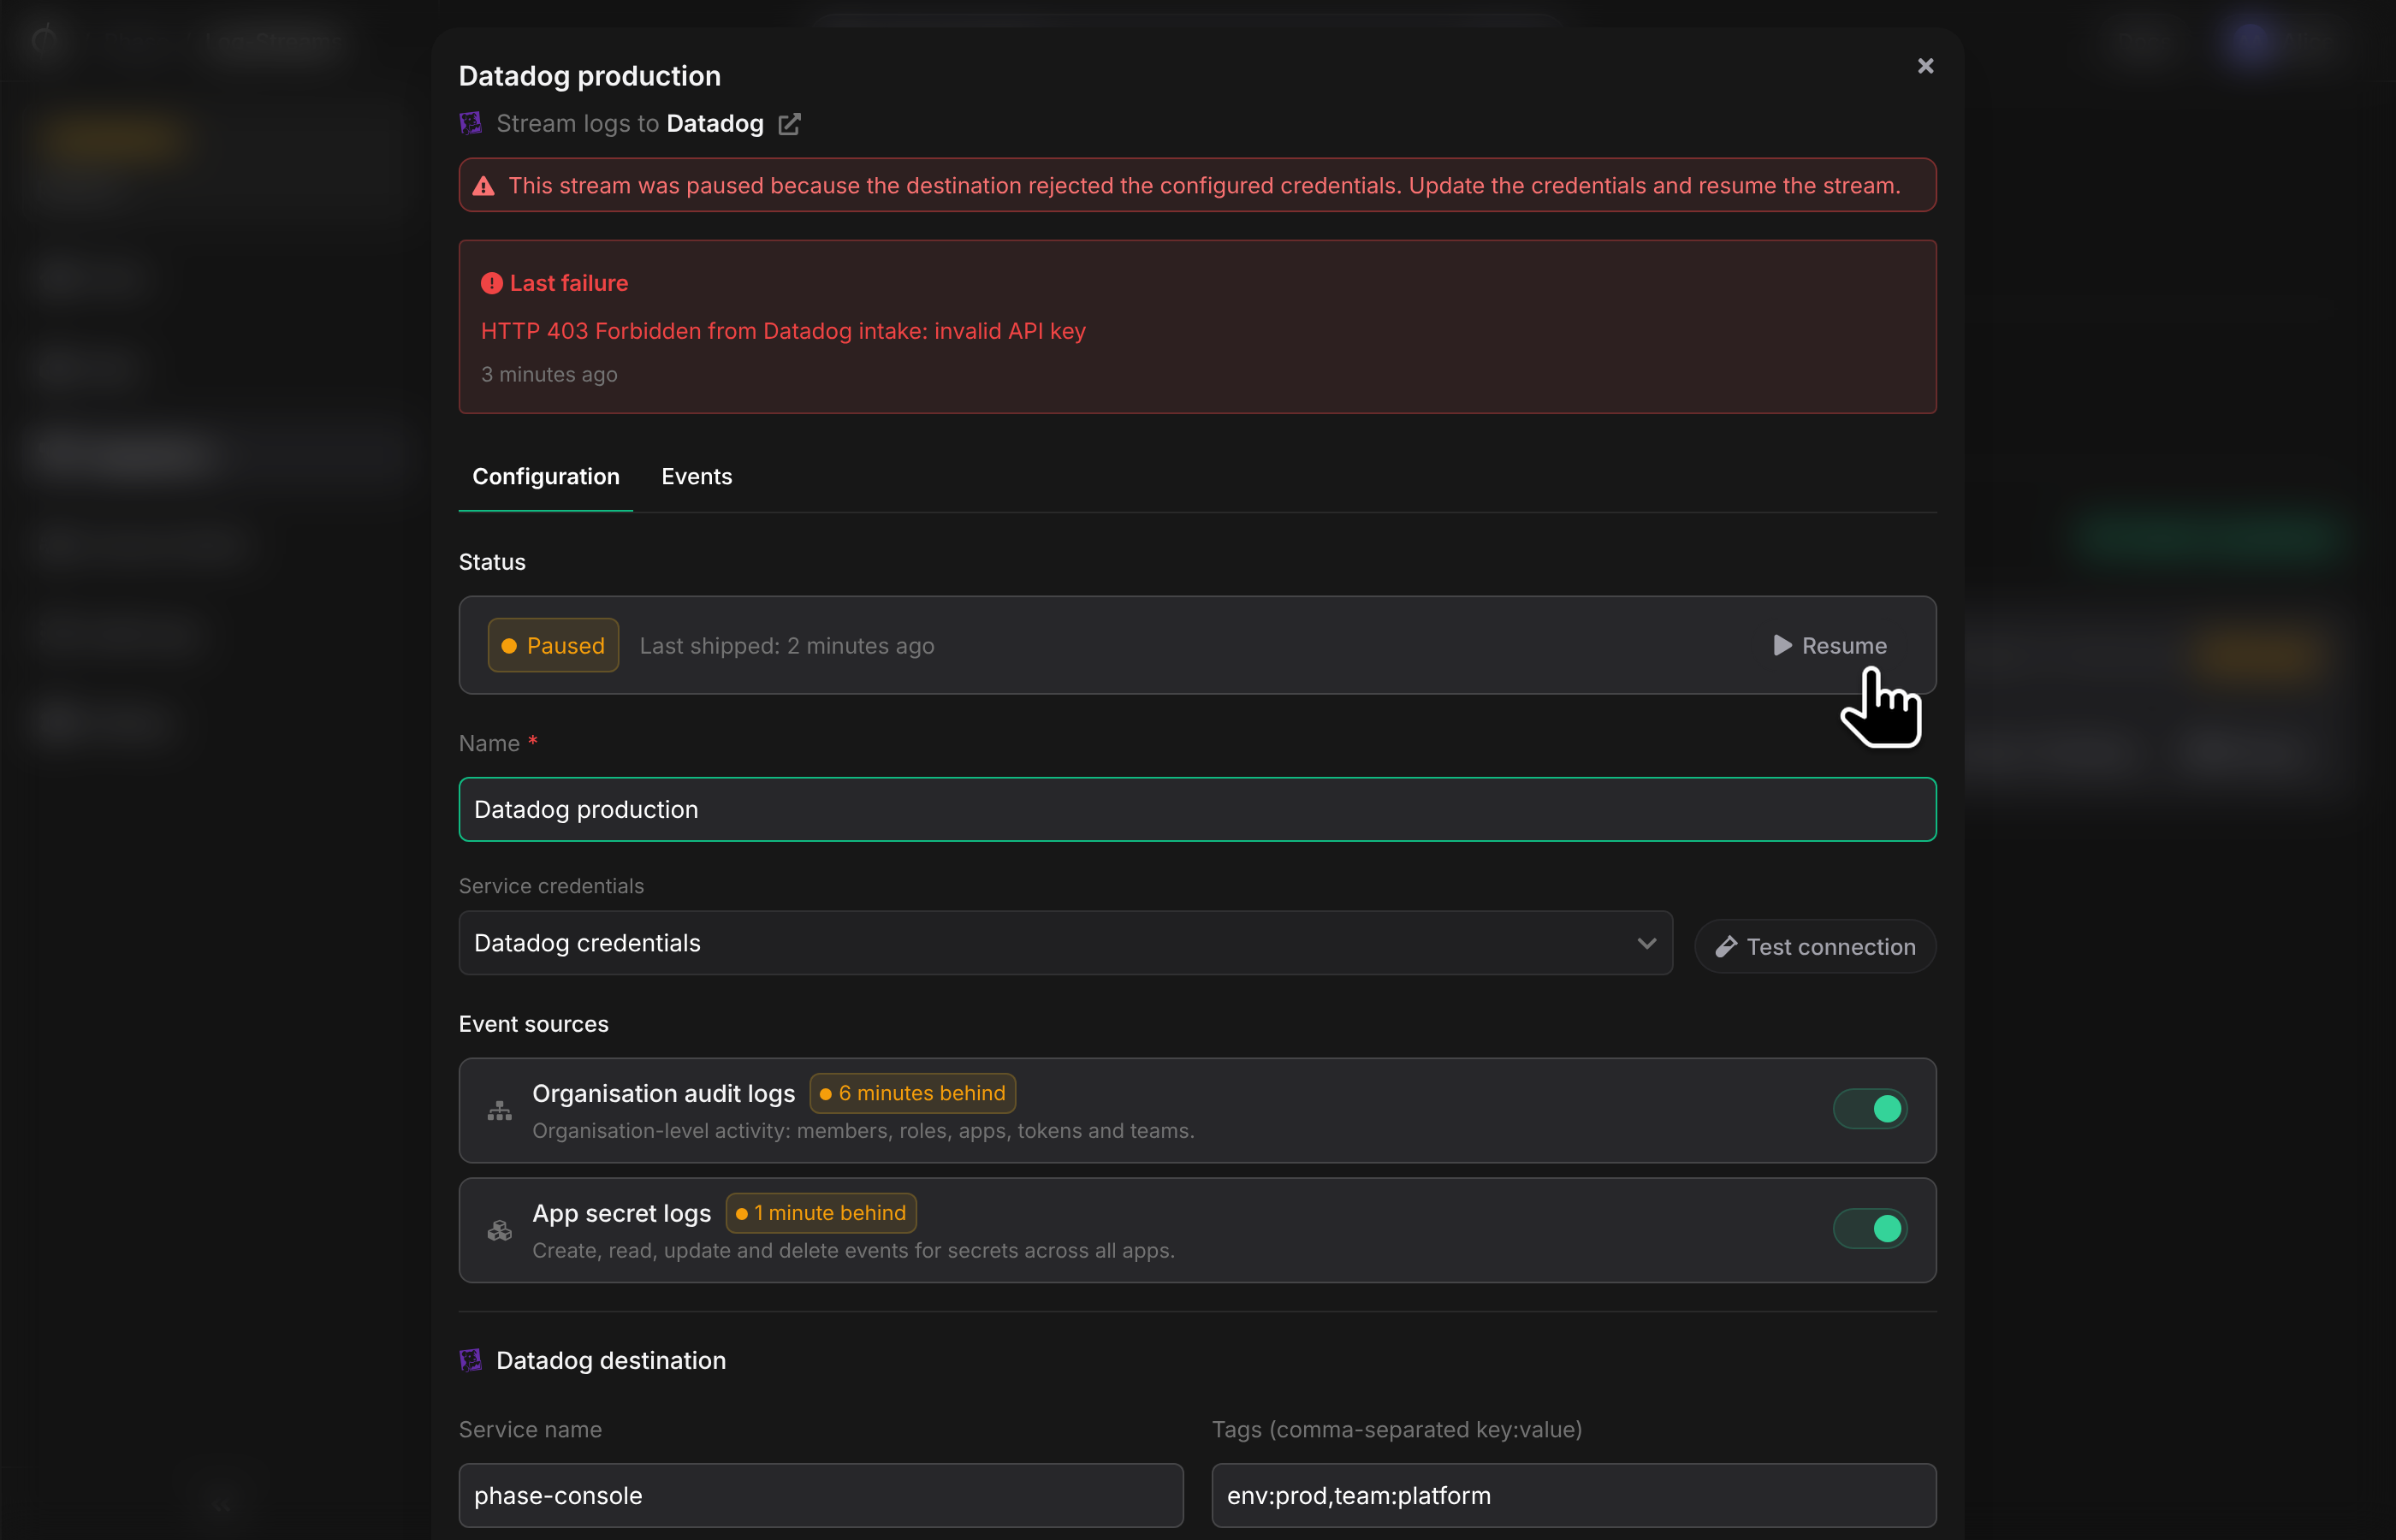
Authentication failures skip retries entirely and pause the stream (retrying with a dead key is pointless). Fix the credentials, press Resume, and shipping continues from the stored cursor with no gap.
-
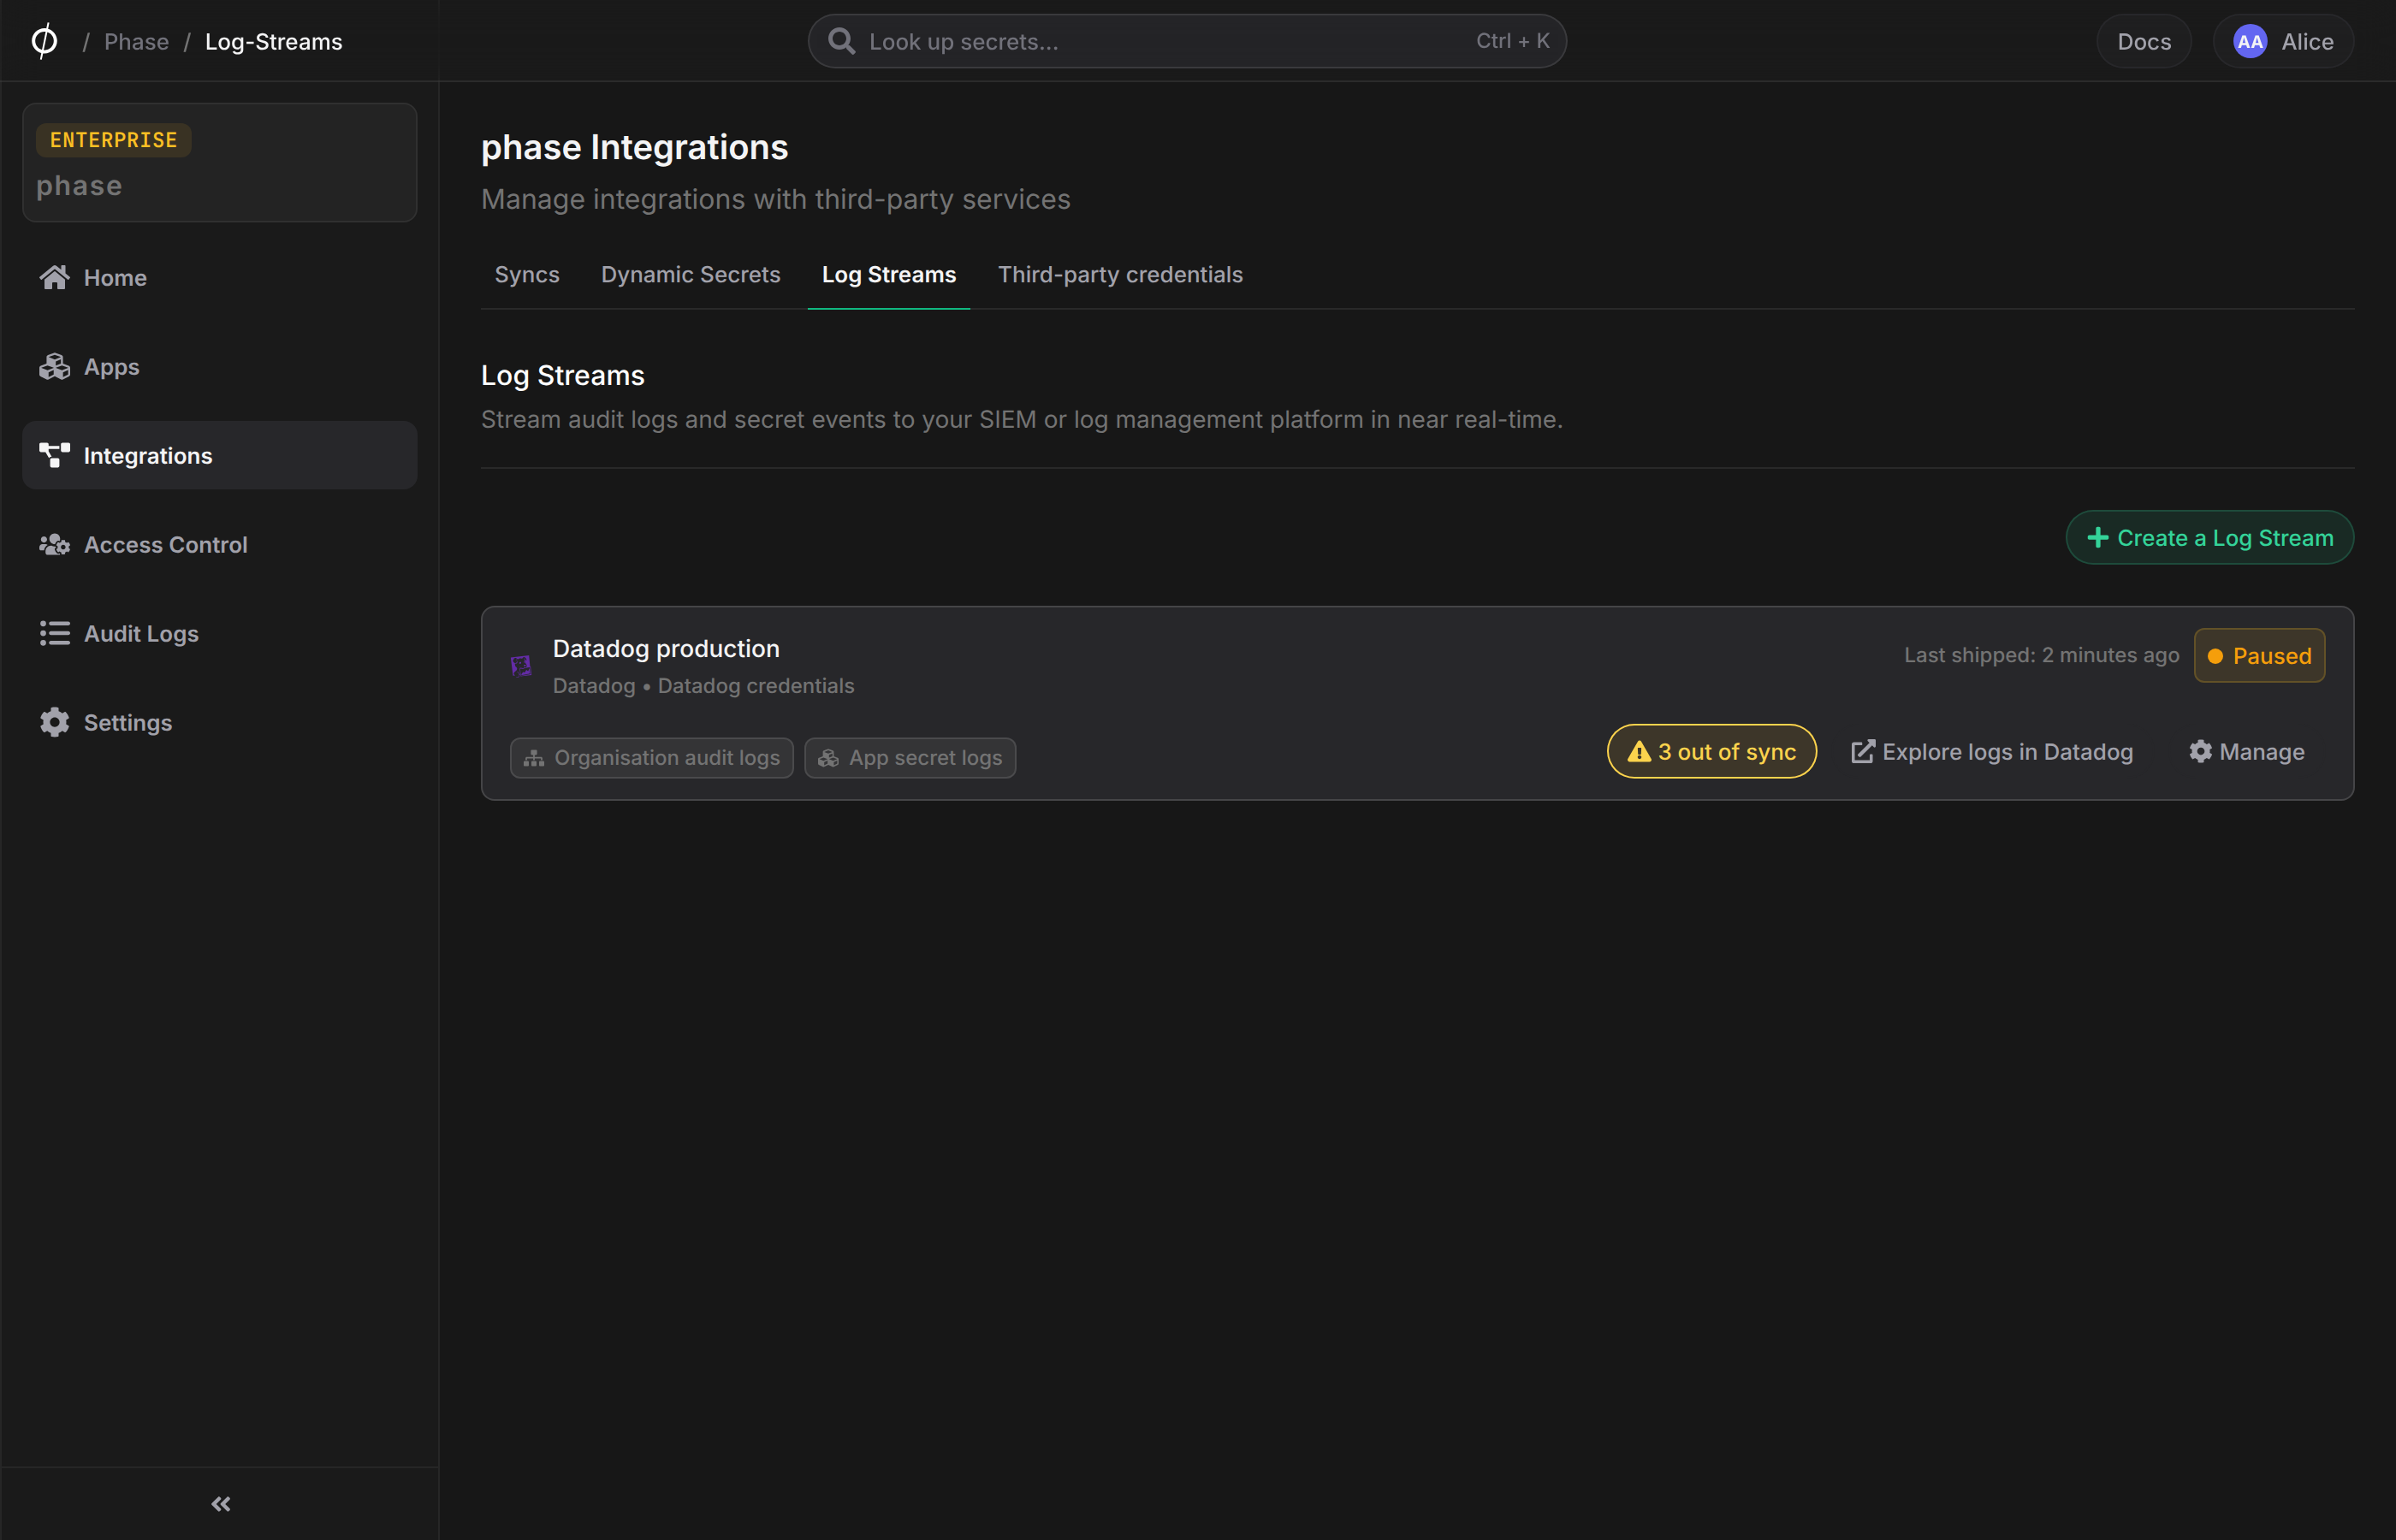
Deleting the stream's third-party credentials also pauses it — a stream without credentials can never deliver, so it is paused visibly rather than left looking healthy. Select new credentials in the stream's configuration, save, and resume.
Backfilling missed events
Backfilling covers ranges a stream failed to deliver while active. It does not extend to events from before the stream was created — streams are ship-forward only. Events always remain in Phase regardless of delivery outcome:
- For ranges within the destination's ingestion window: use the Retry button on the failed row — no other steps needed.
- Ranges that have fallen outside the ingestion window can no longer be re-shipped — the destination would silently discard them. The events remain queryable in the Console: organisation audit events under Logs, and secret events in each app's Logs tab.
Managing streams
-
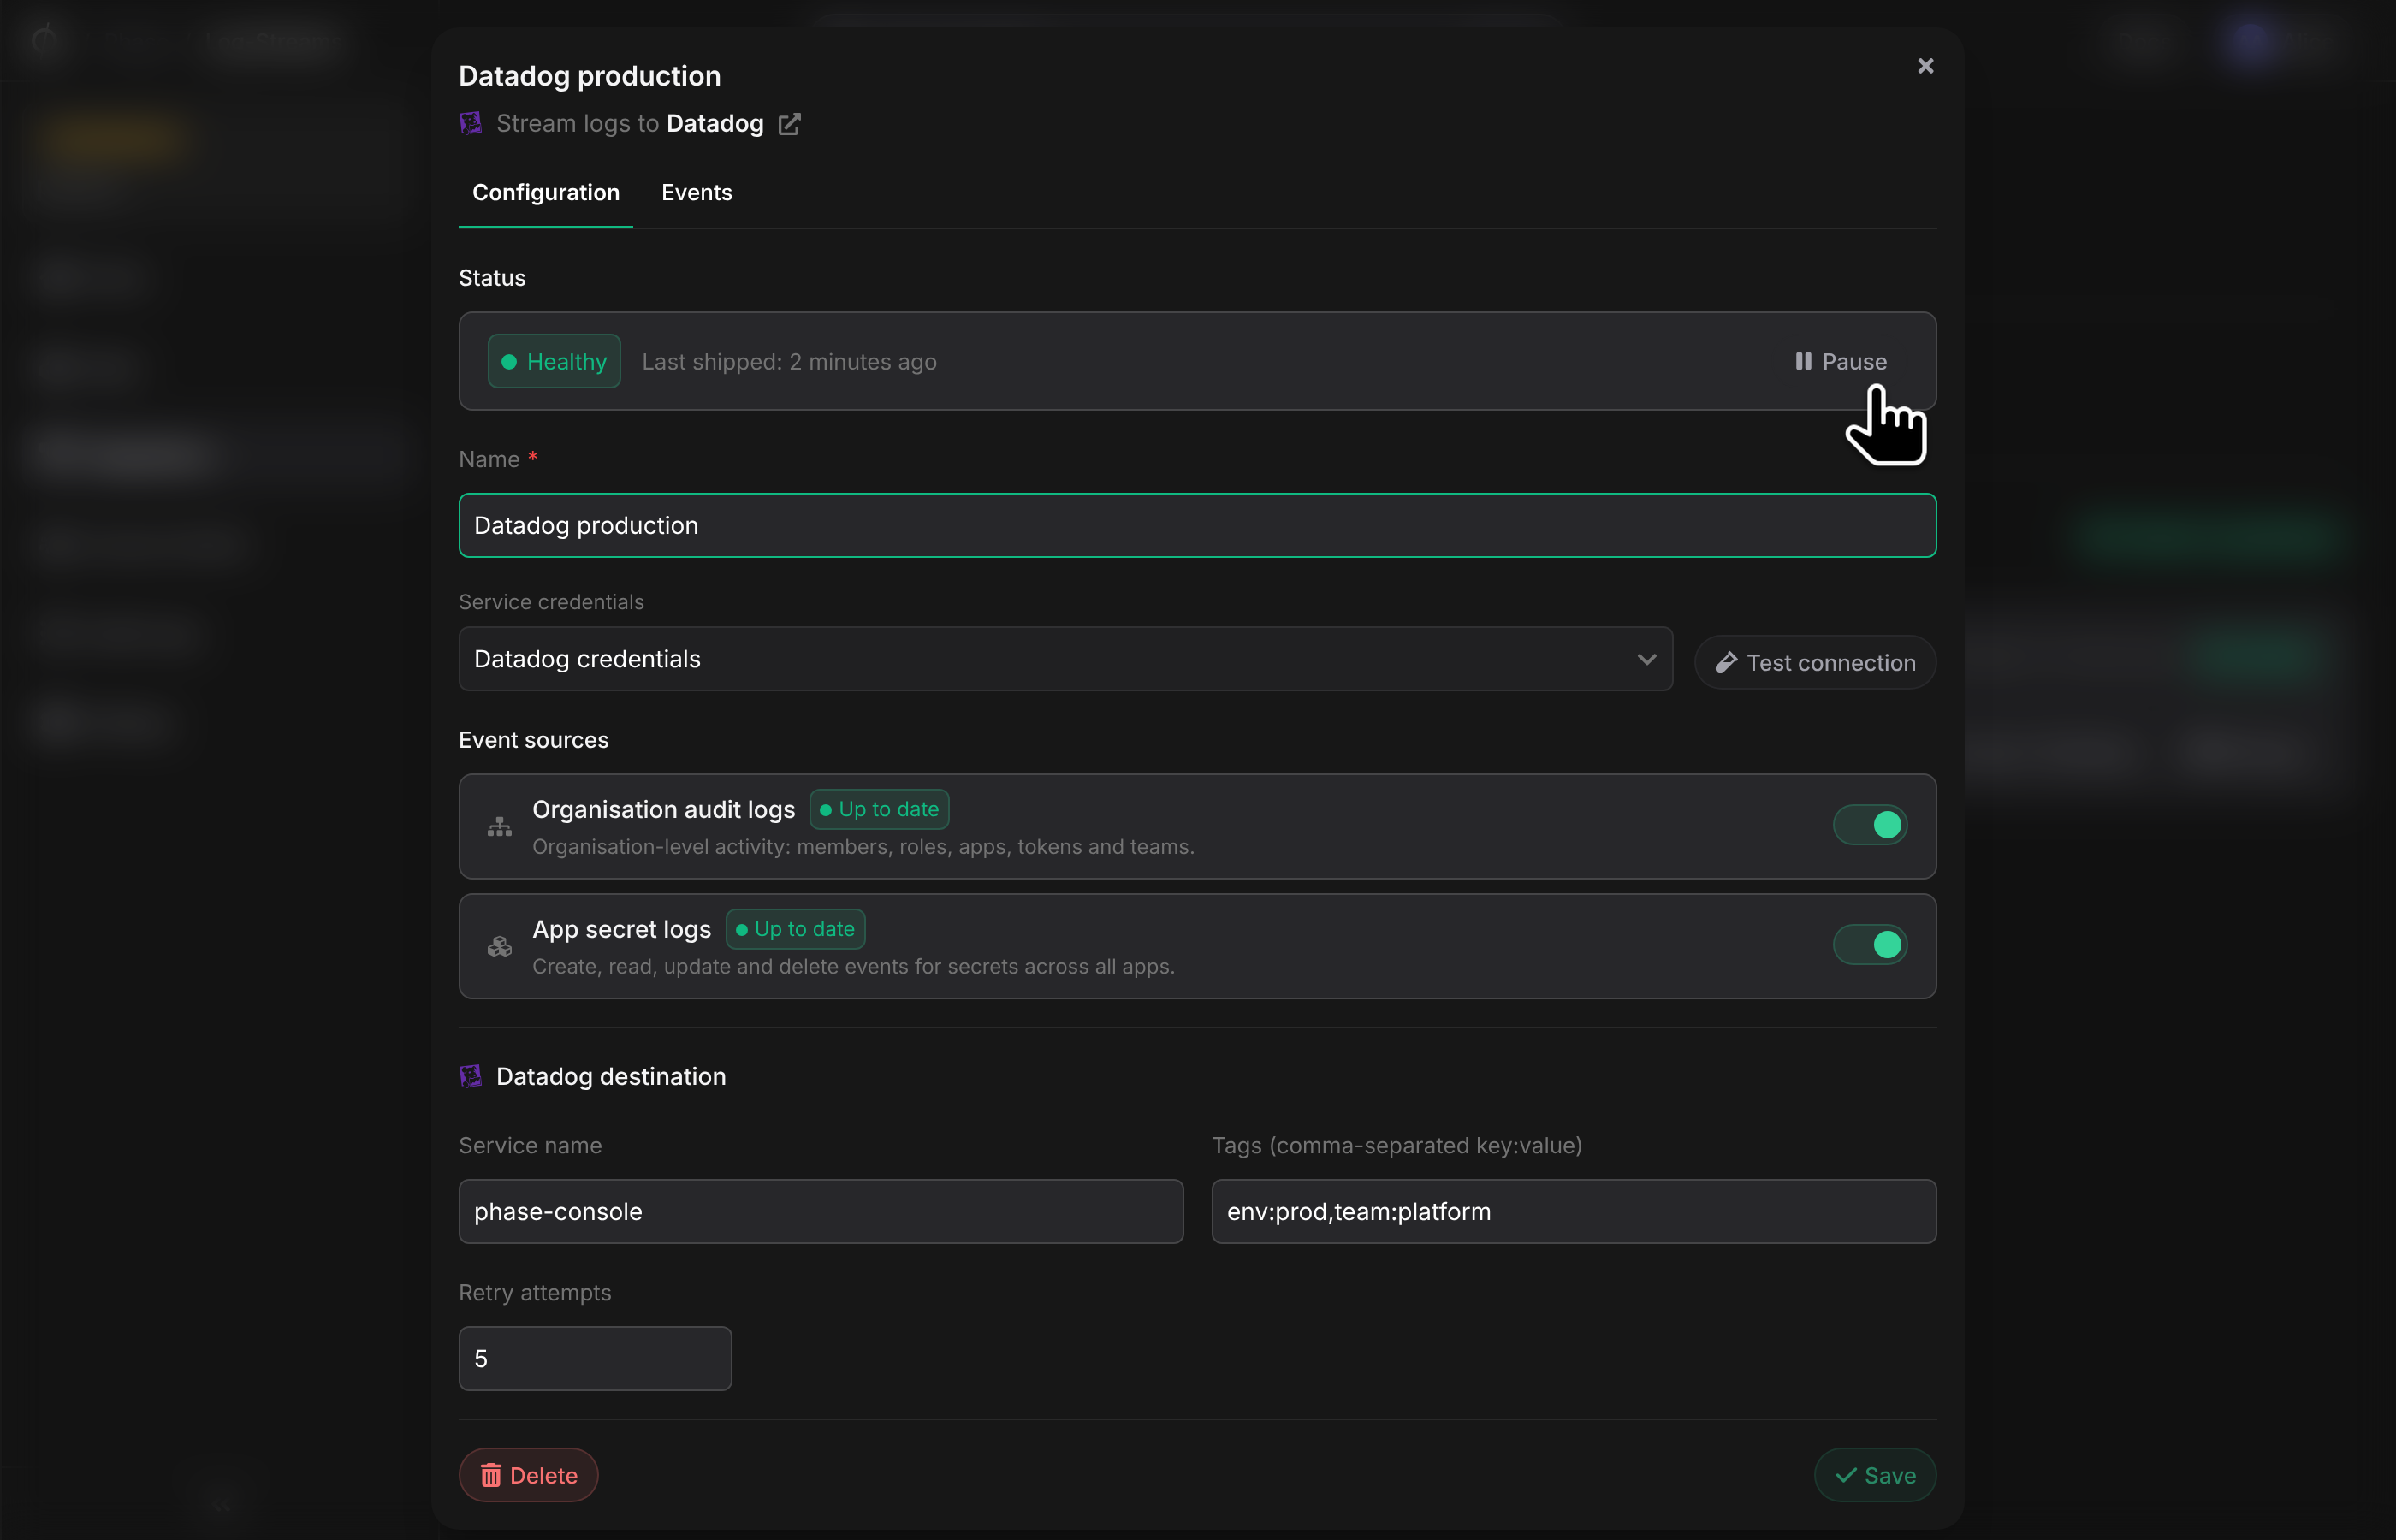
Pause / Resume: pausing stops all egress; resuming continues from the stored cursor with no gap (subject to the destination's ingestion window).
-
Events tab: every delivery is recorded —
Completed,FailedorSkipped— with its event count, attempts, exact time range and error detail. Failed rows stay listed until they are resolved by a successful re-ship, and can be retried individually. Skipped rows record ranges that fell outside the destination's ingestion window — they cannot be re-shipped and auto-resolve as Expired.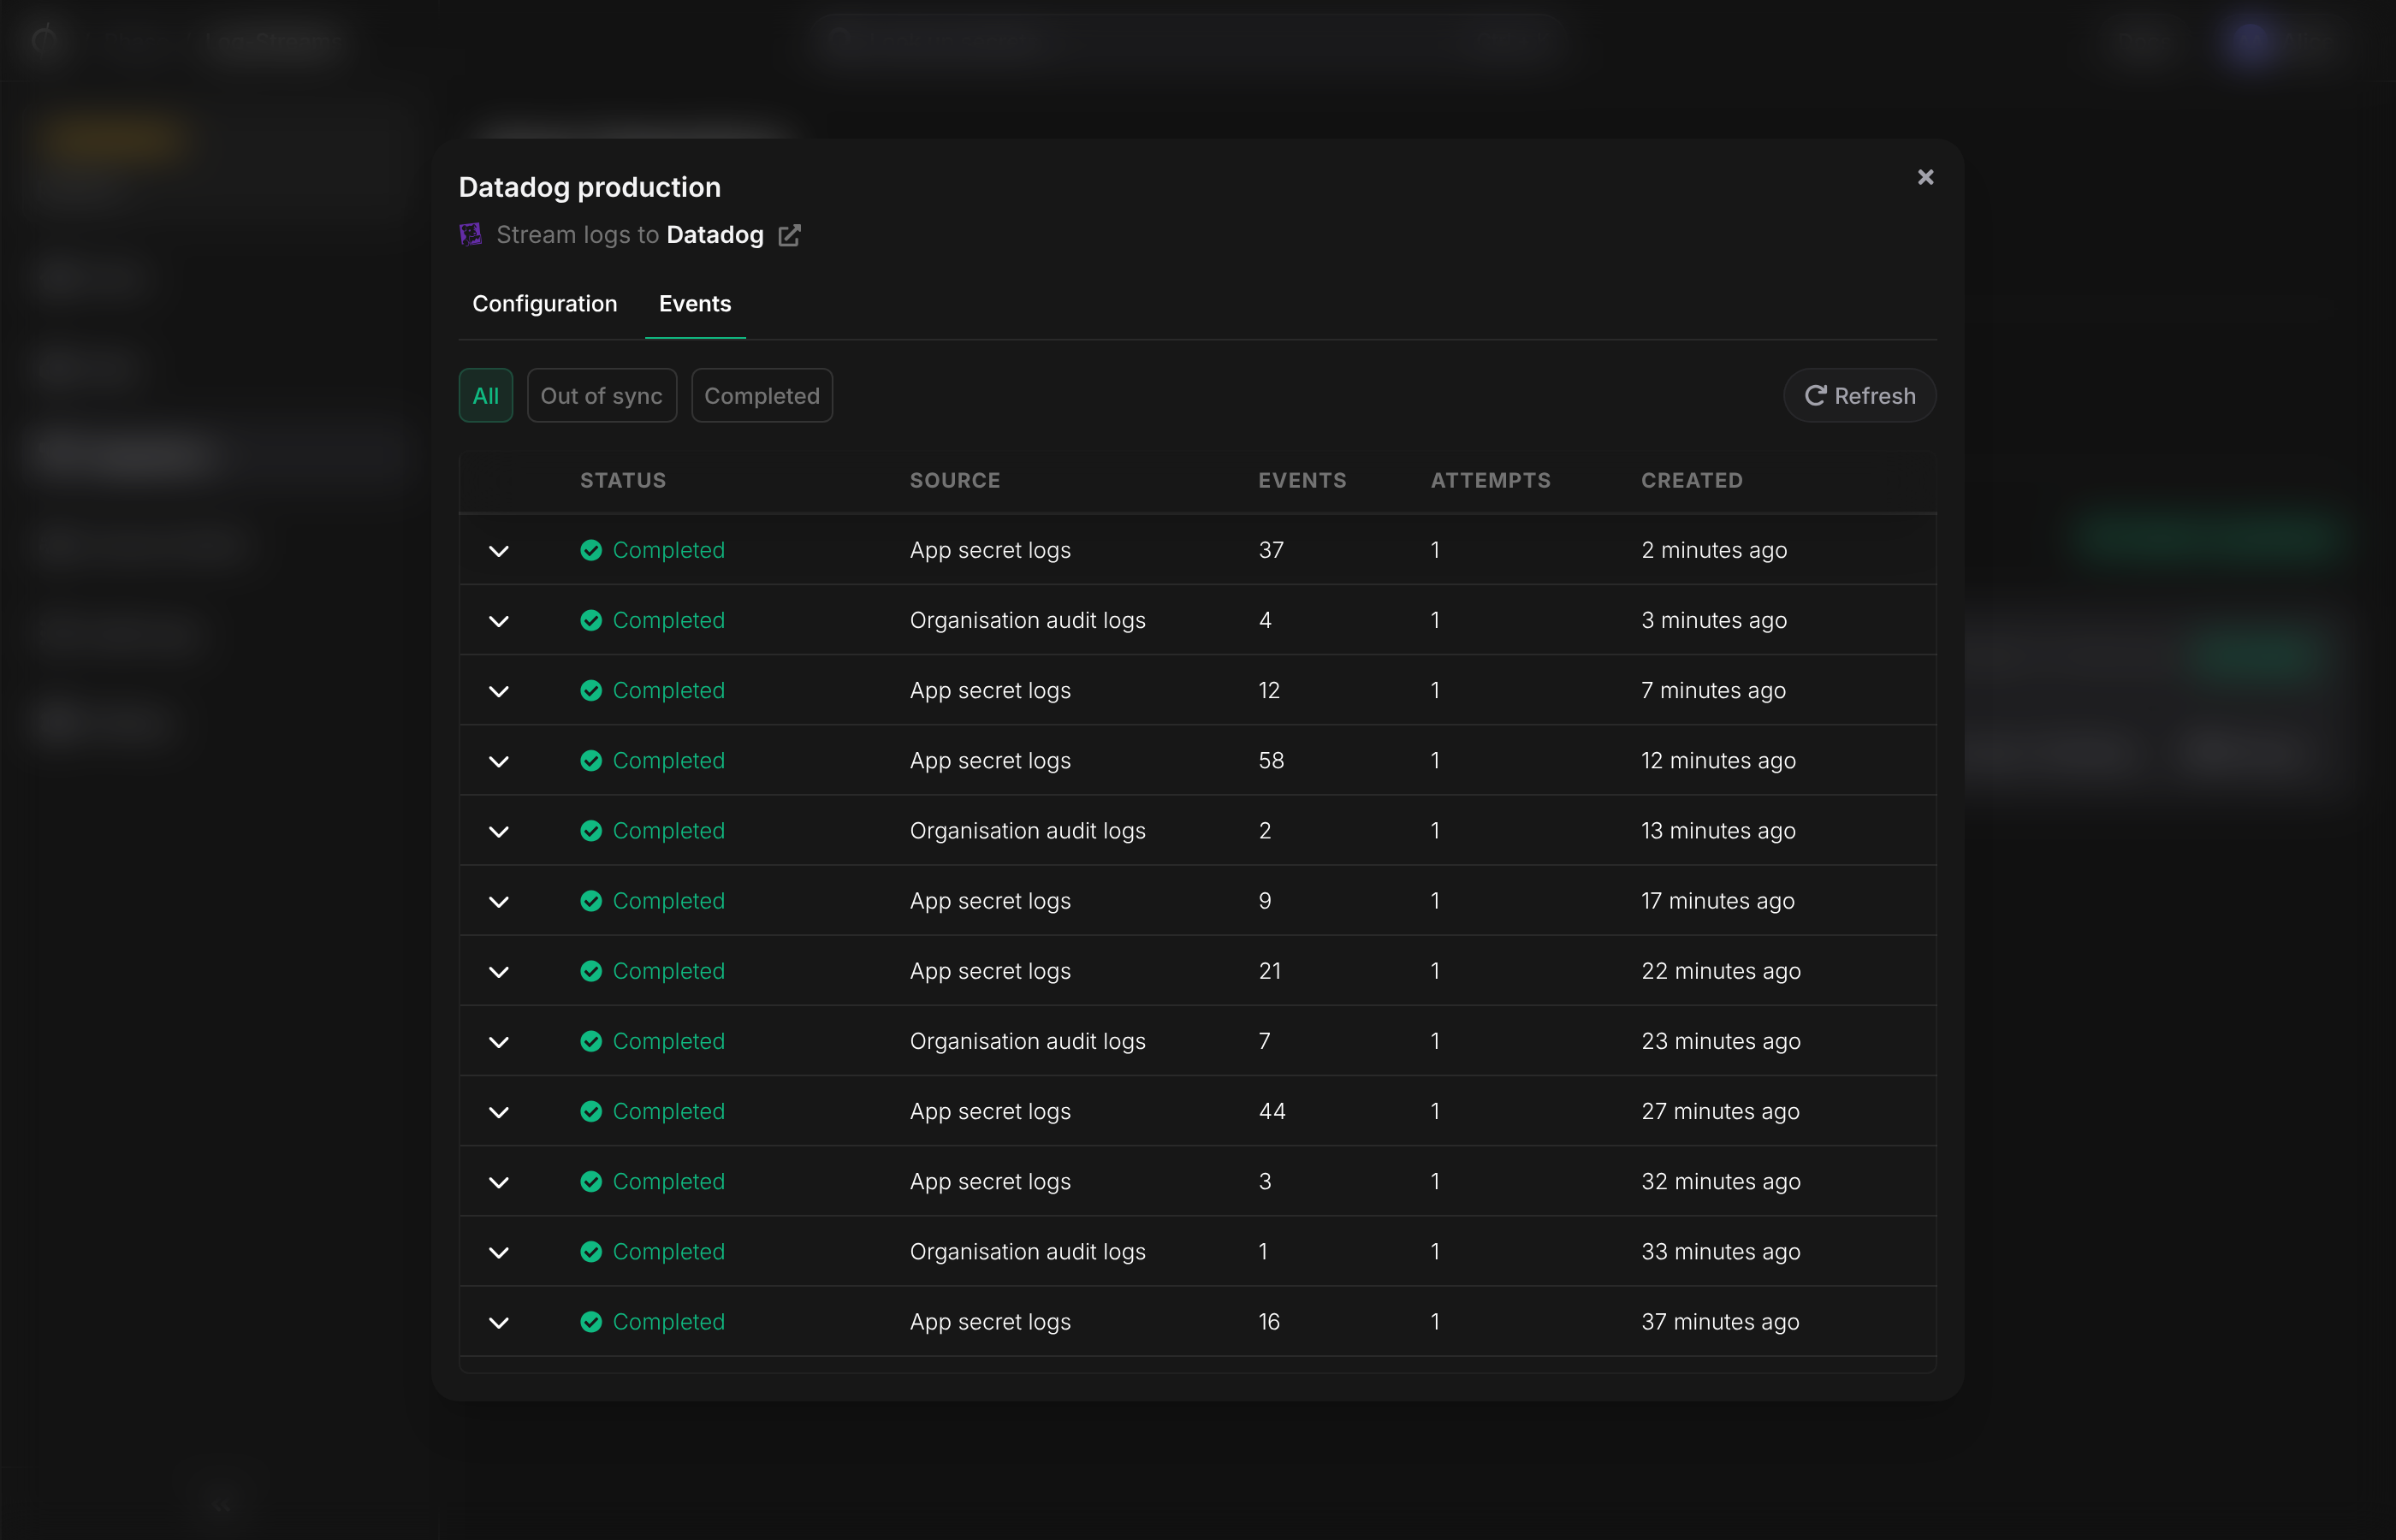
-
Stream options: a
servicename for the destination (defaultphase-console), free-form tags, and the per-chunk retry limit.
Datadog
Stream logs to Datadog for monitoring, alerting and Cloud SIEM detection. Works with all Datadog site regions (US1, US3, US5, EU1, UK1, AP1, AP2, US1-FED and US2-FED).
Step 1: Create a Datadog API key
-
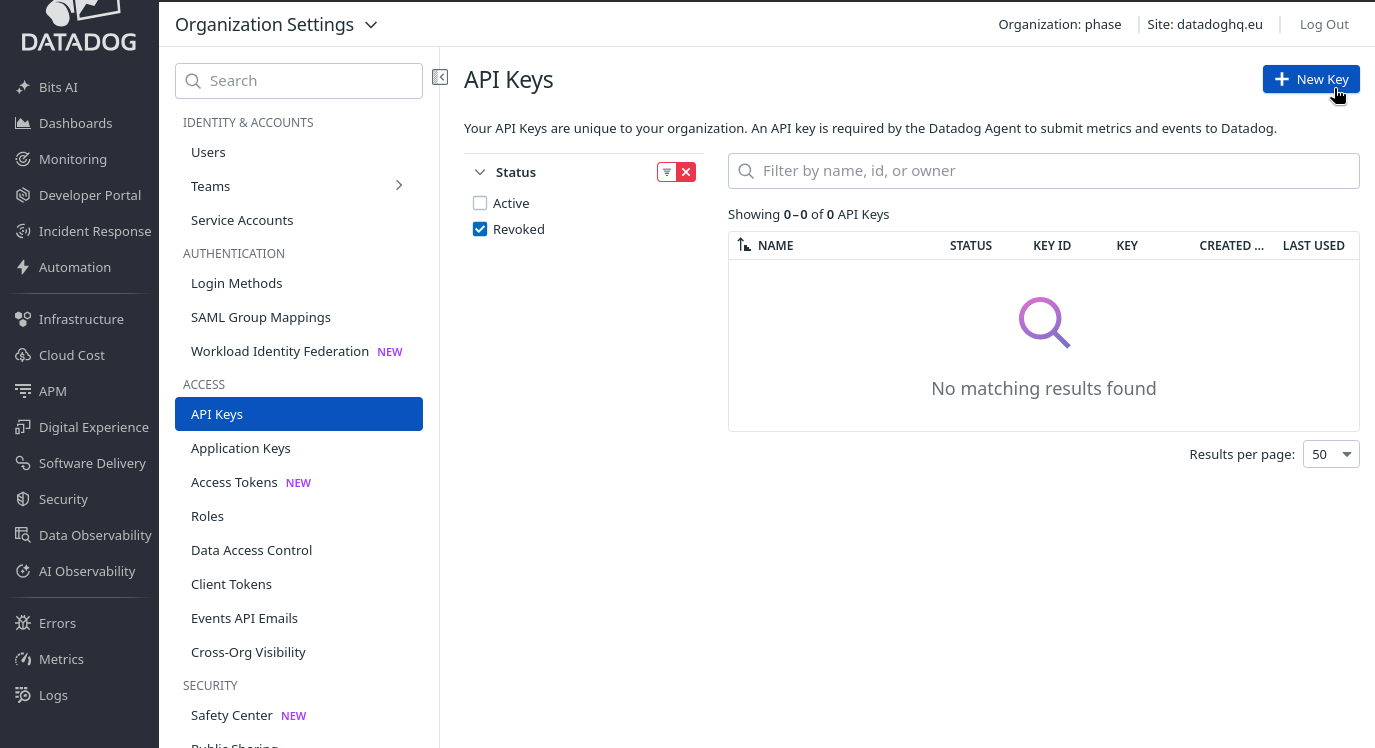
Log in to Datadog and go to Organization Settings → API Keys.
-
Click + New Key and name it, e.g.
phase-log-stream.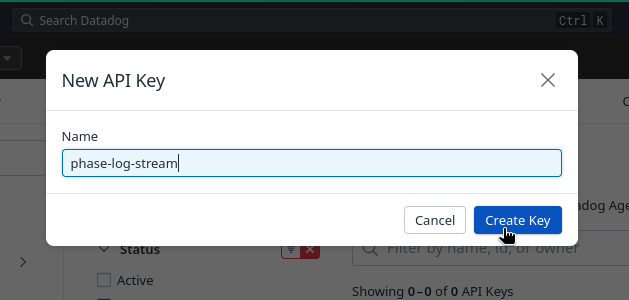
-
Copy the key value.
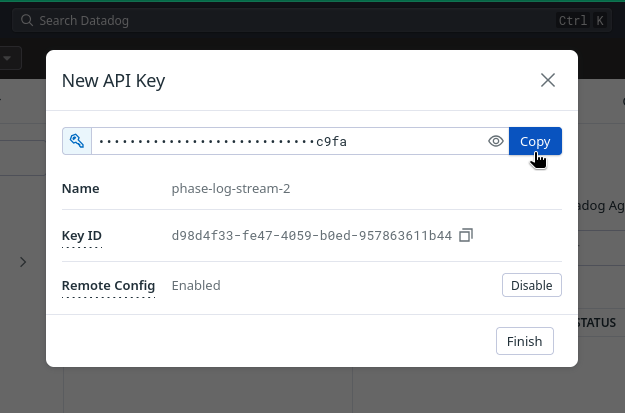
Note: API keys are the right credential for log shipping: they are org-level, intake-only by design (they can submit data but cannot read or manage anything), cannot be scoped further, and remain valid even if the user who created them is later disabled.
- Note your Datadog site — you can see it in your browser's address bar, e.g.
us3.datadoghq.com,datadoghq.com, ordatadoghq.eu.
Step 2: Add Datadog credentials to Phase
-
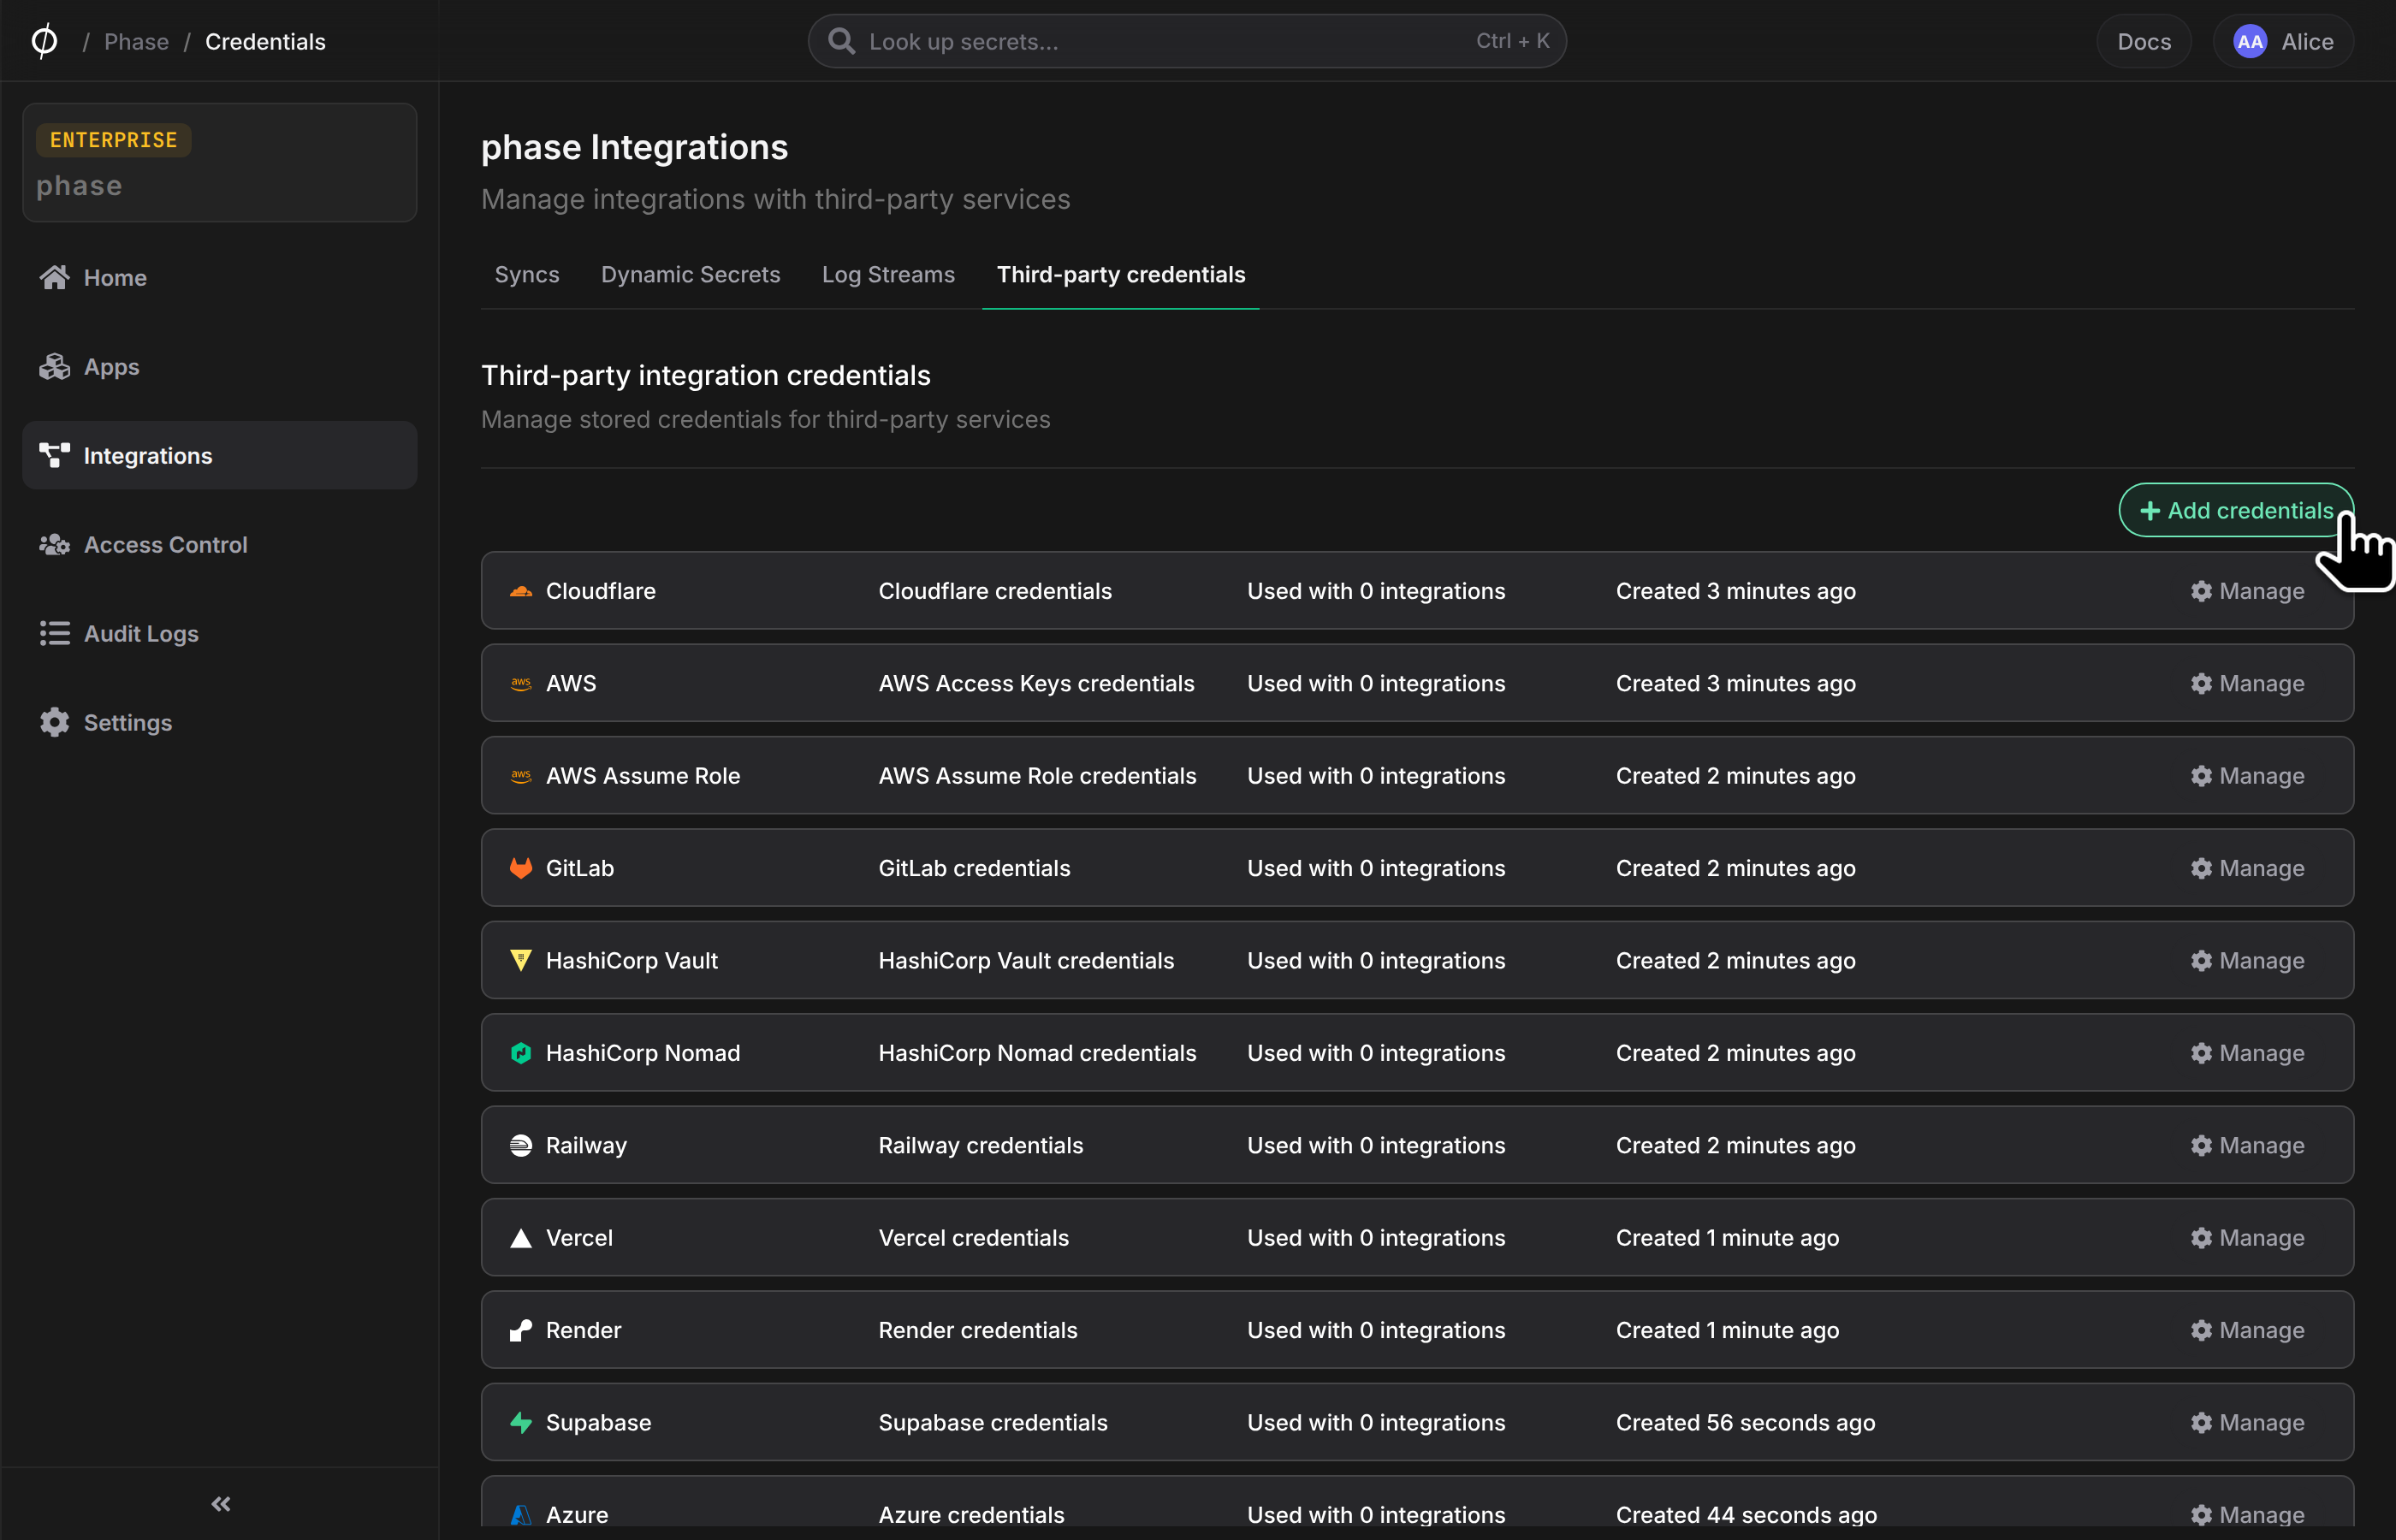
In the Phase Console, go to Integrations → Third-party credentials and click + Add credentials.
-
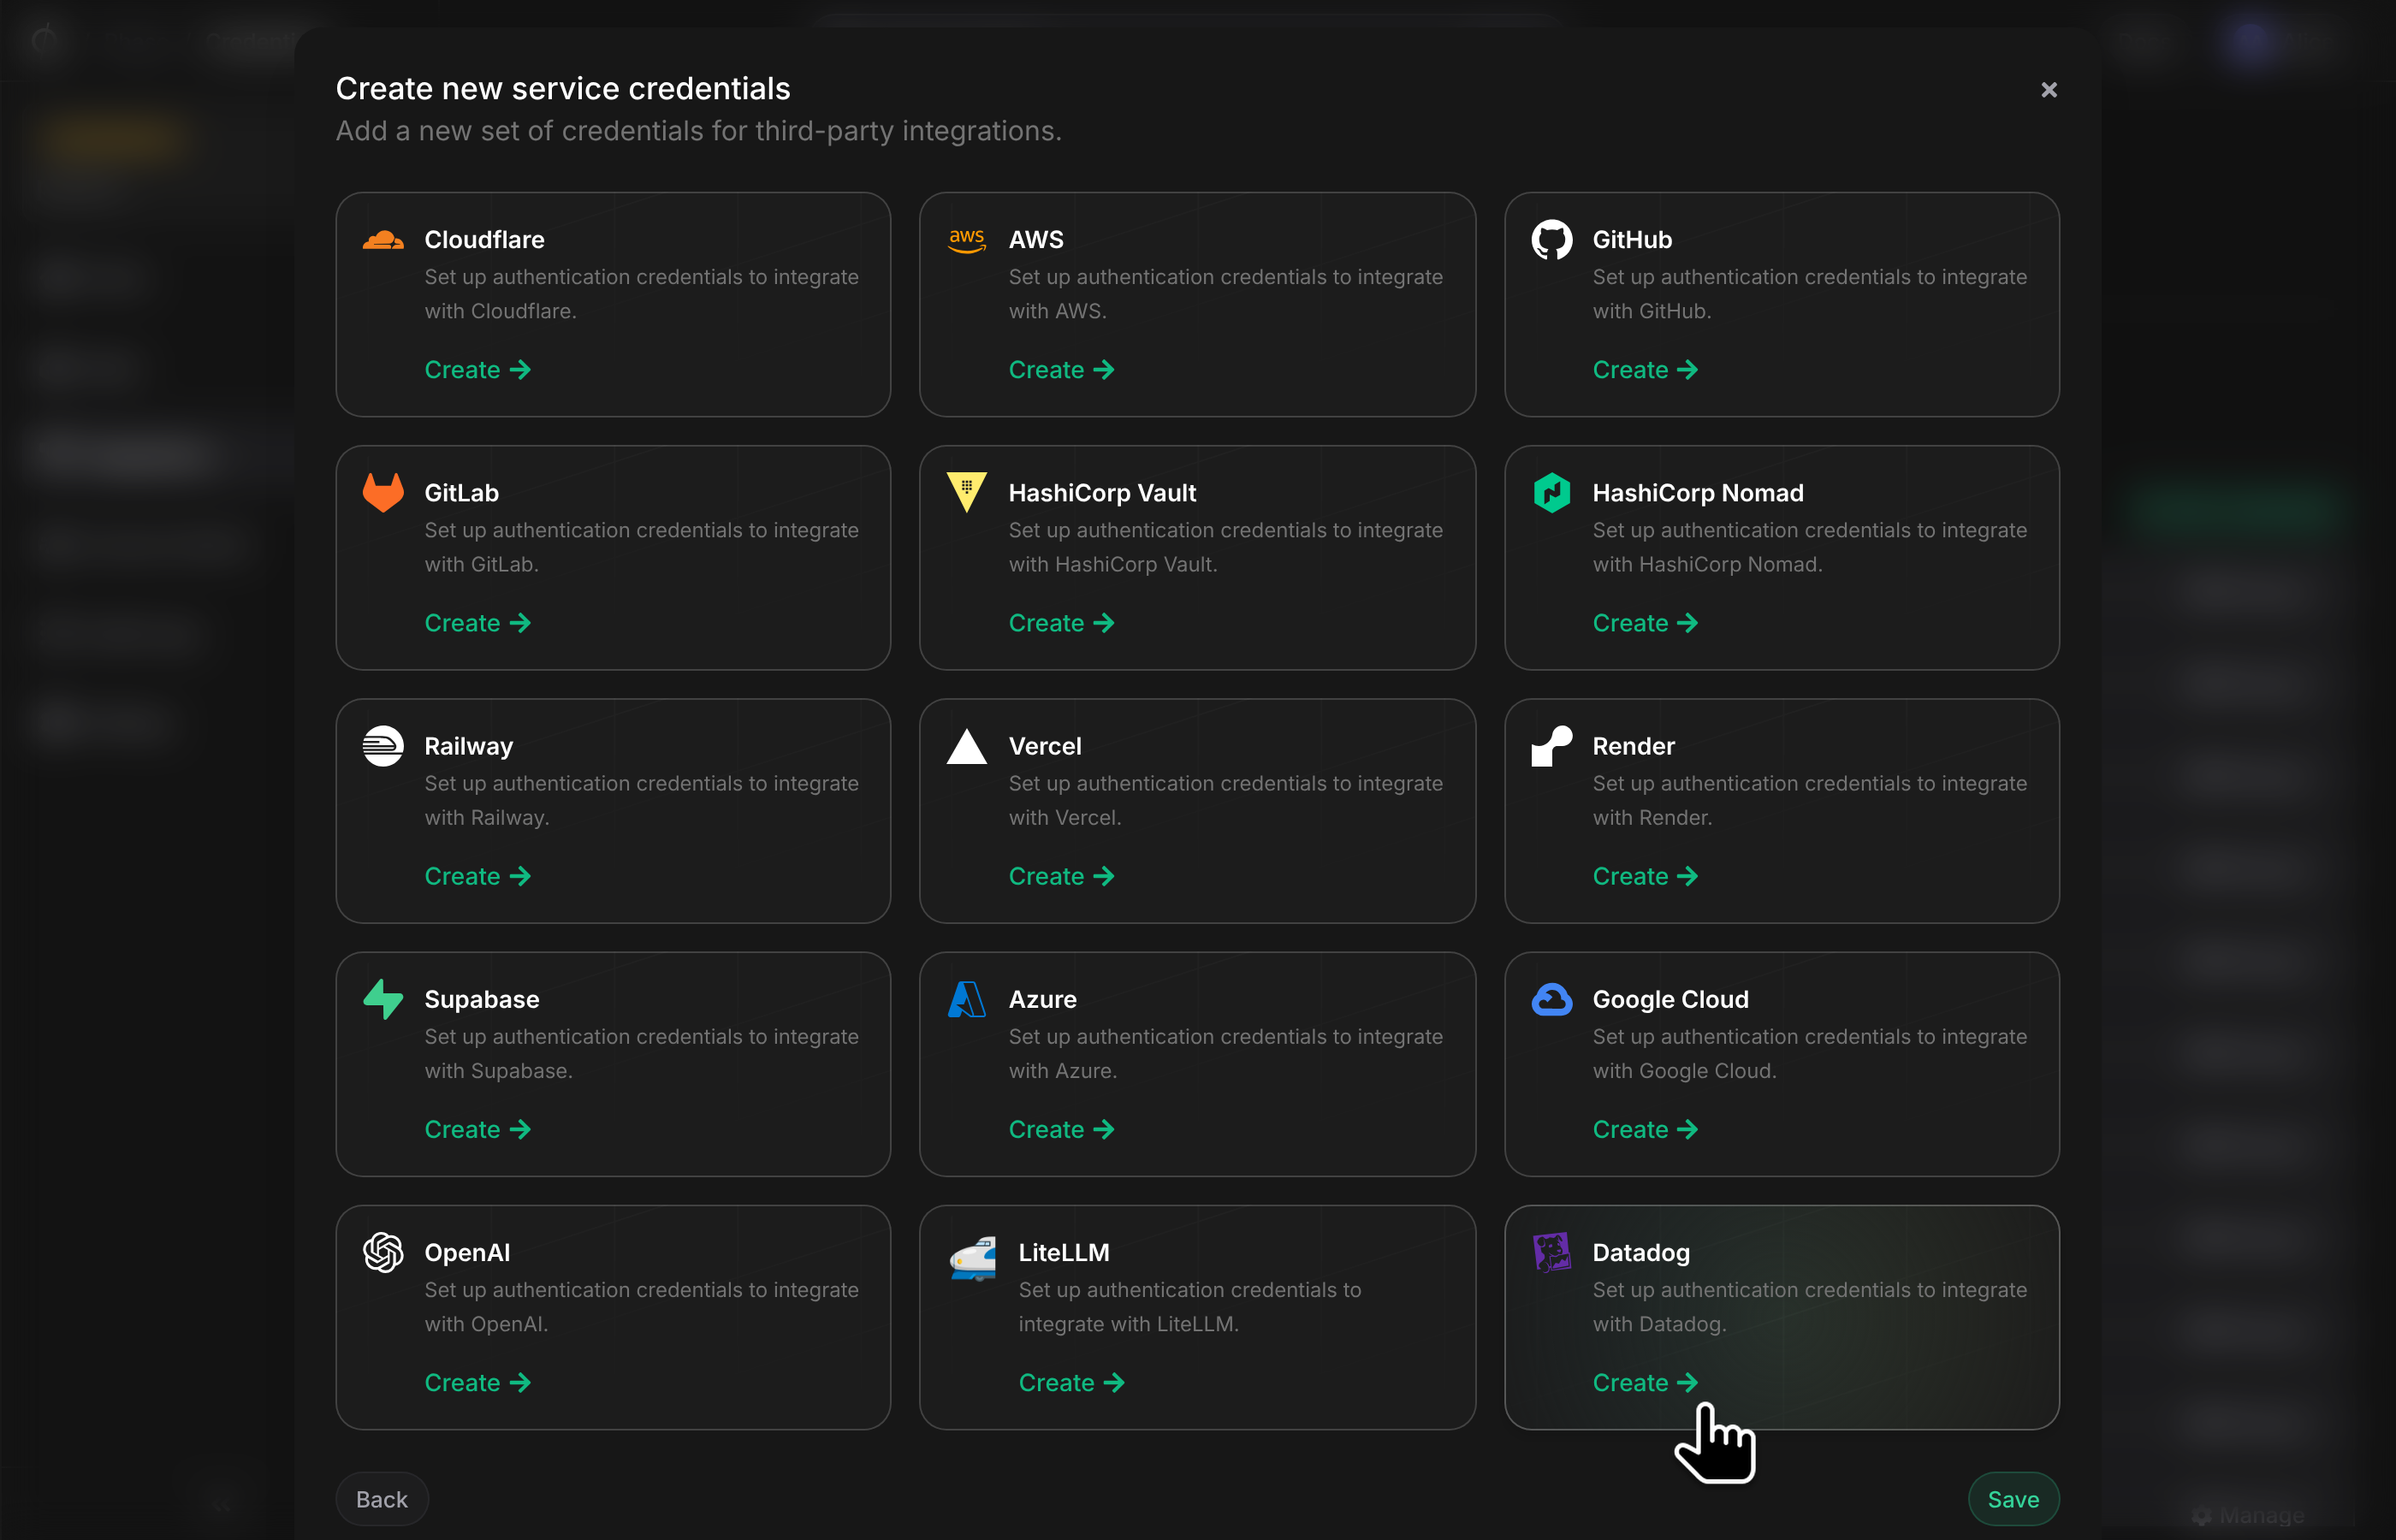
Select the Datadog card.
-
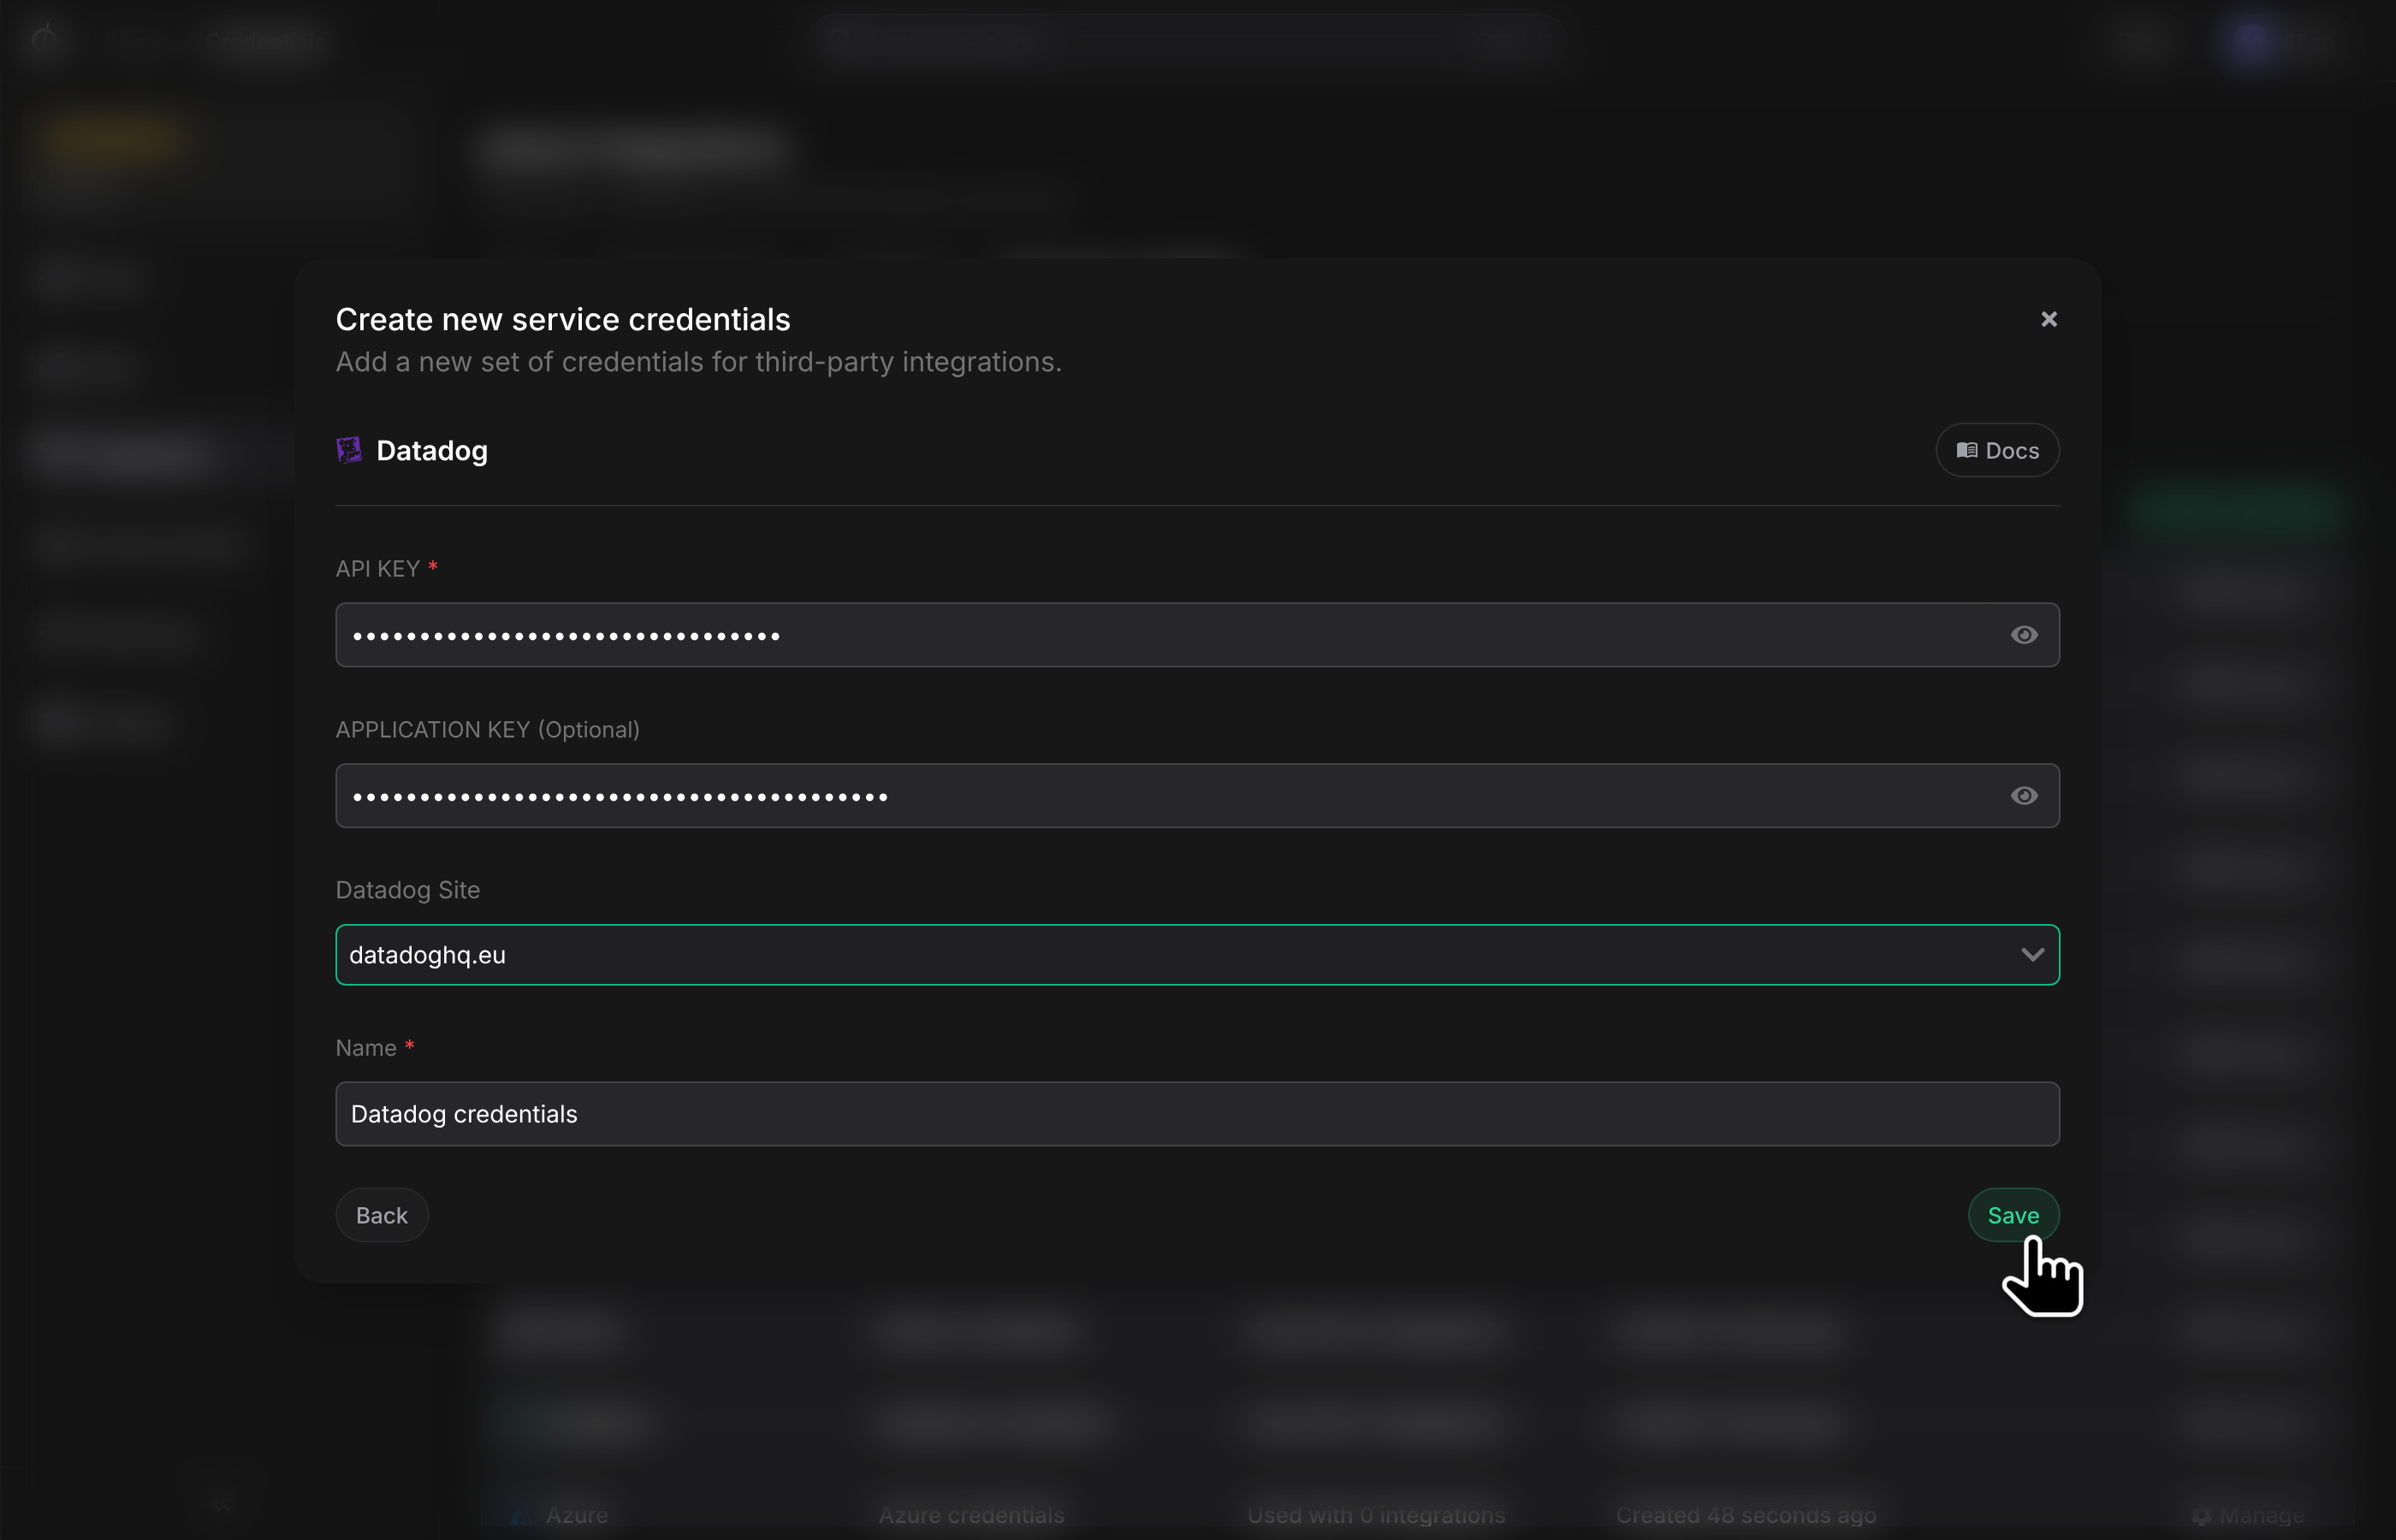
Enter your API key and pick your site from the region dropdown. The optional application key is not required for log streaming.
-
Give the credentials a descriptive name and save.
Step 3: Create a Log Stream
-
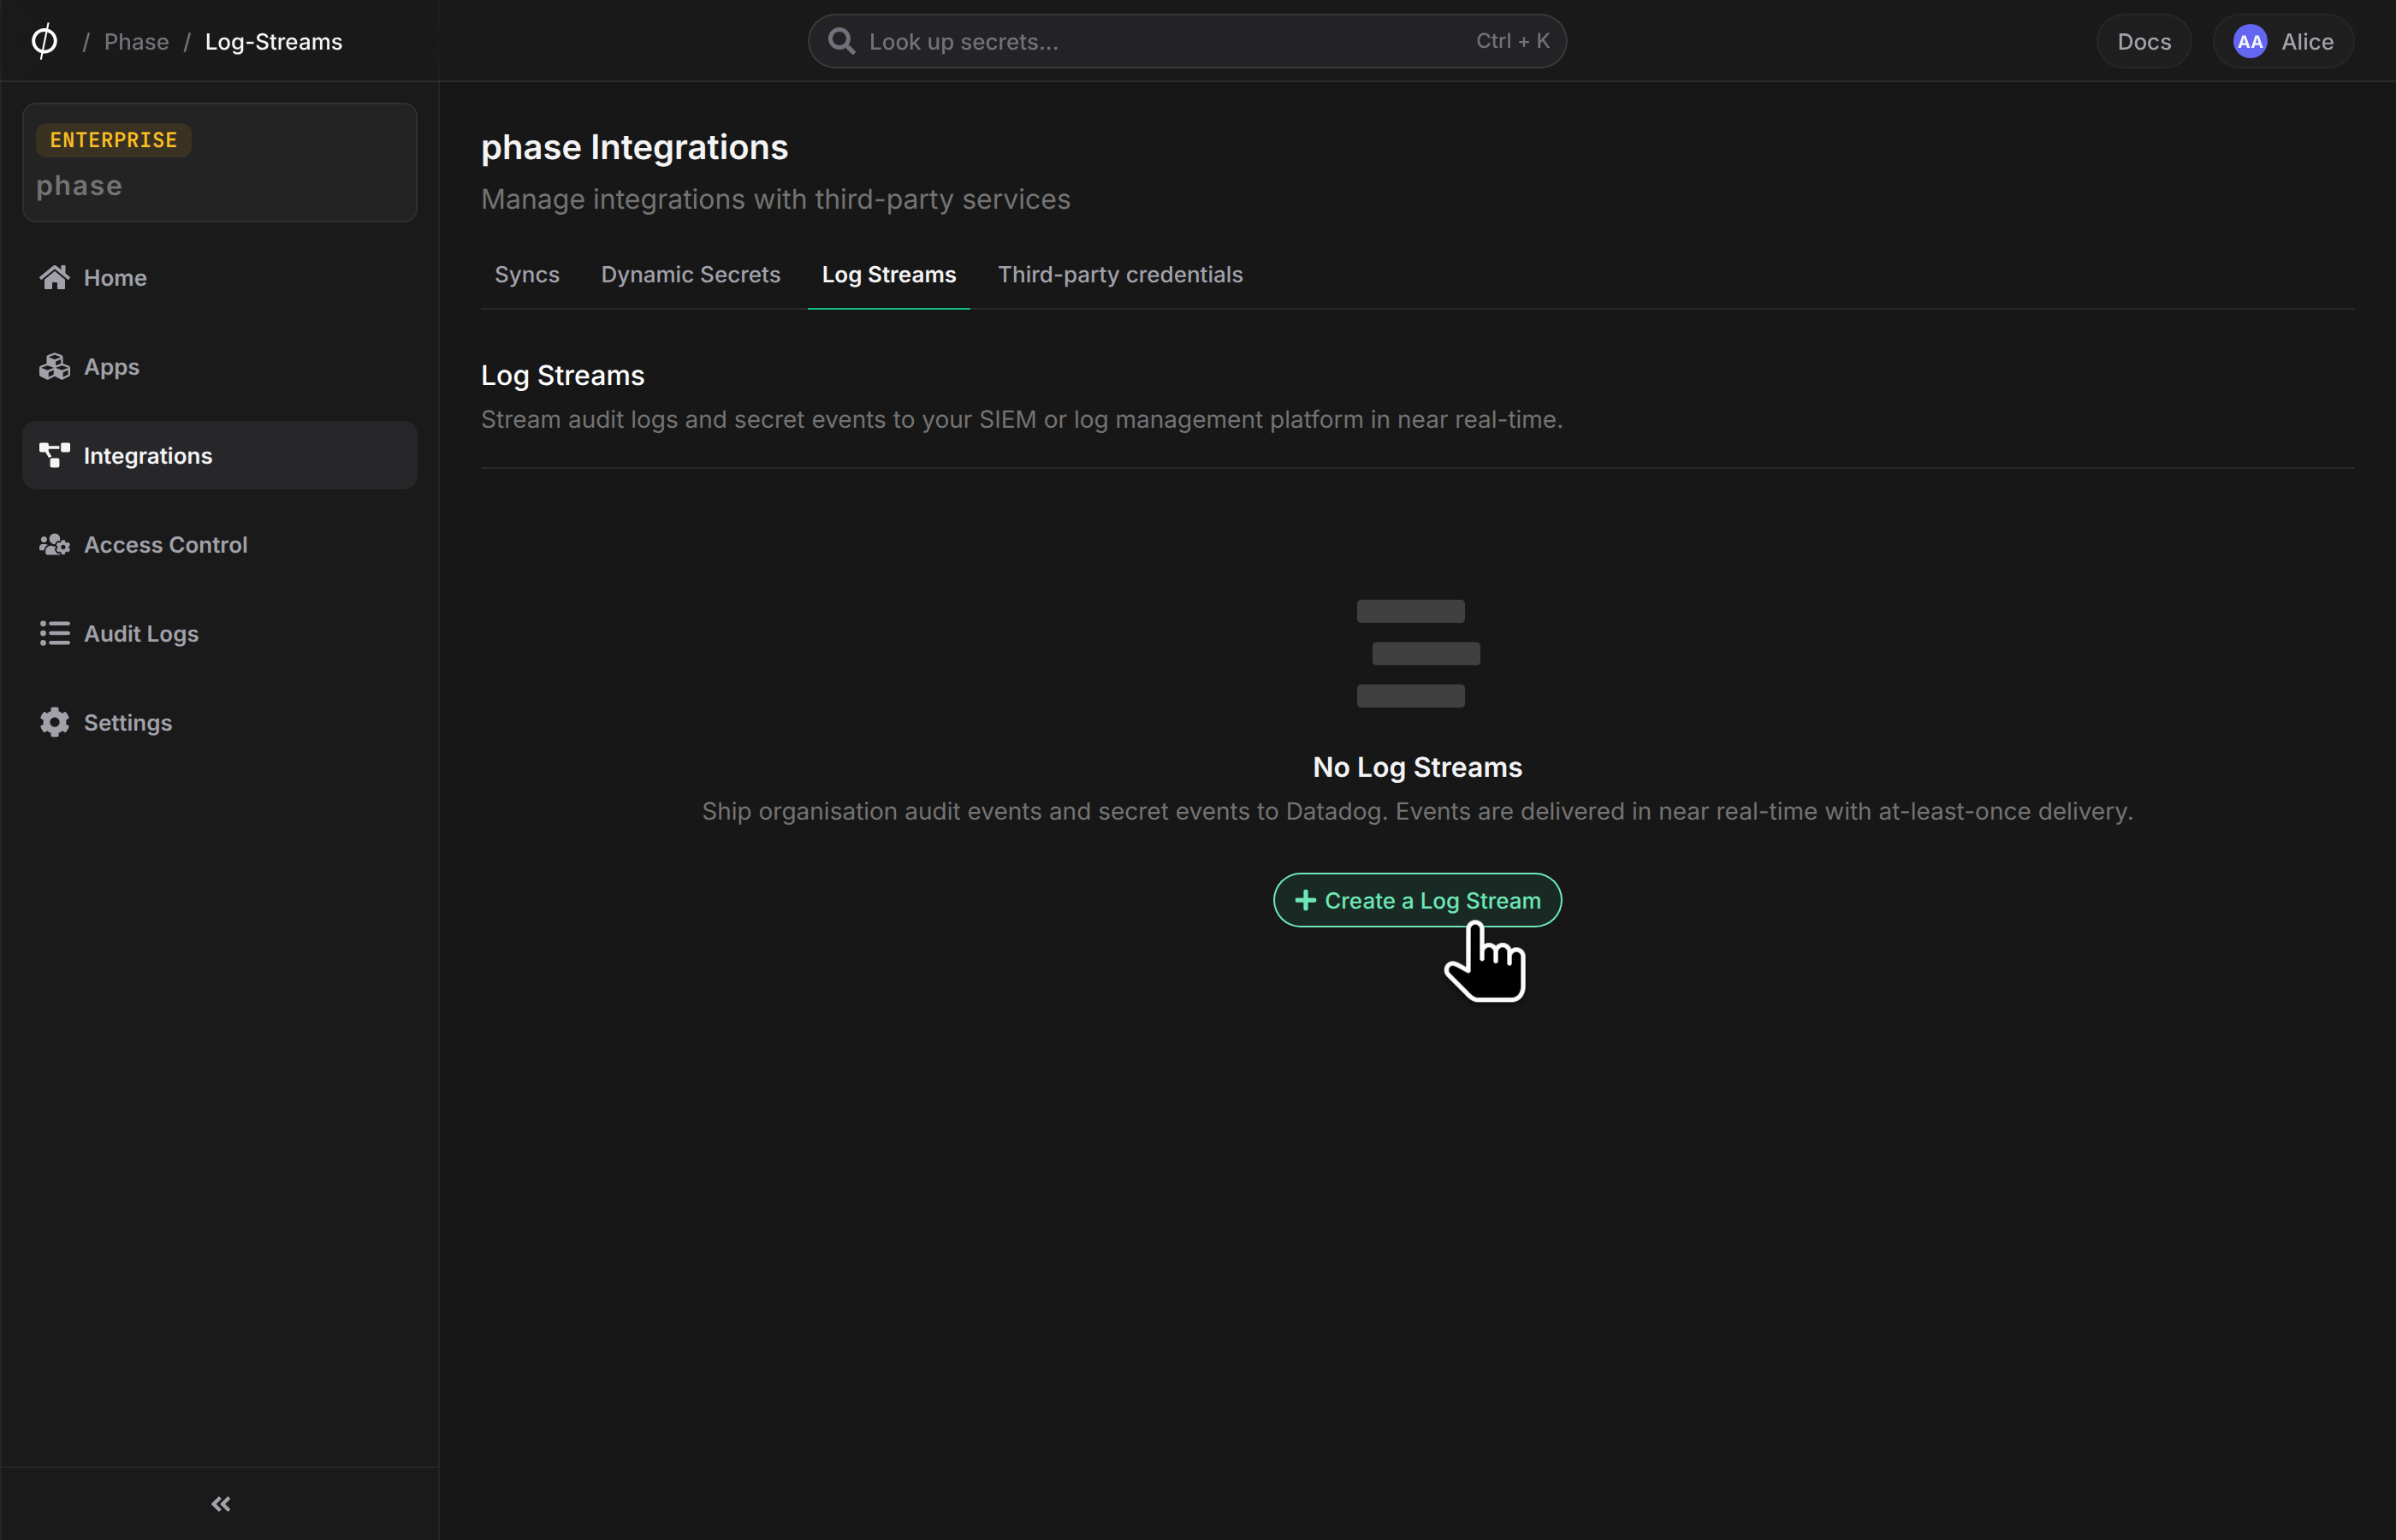
Go to Integrations → Log Streams and click Create a Log Stream.
-
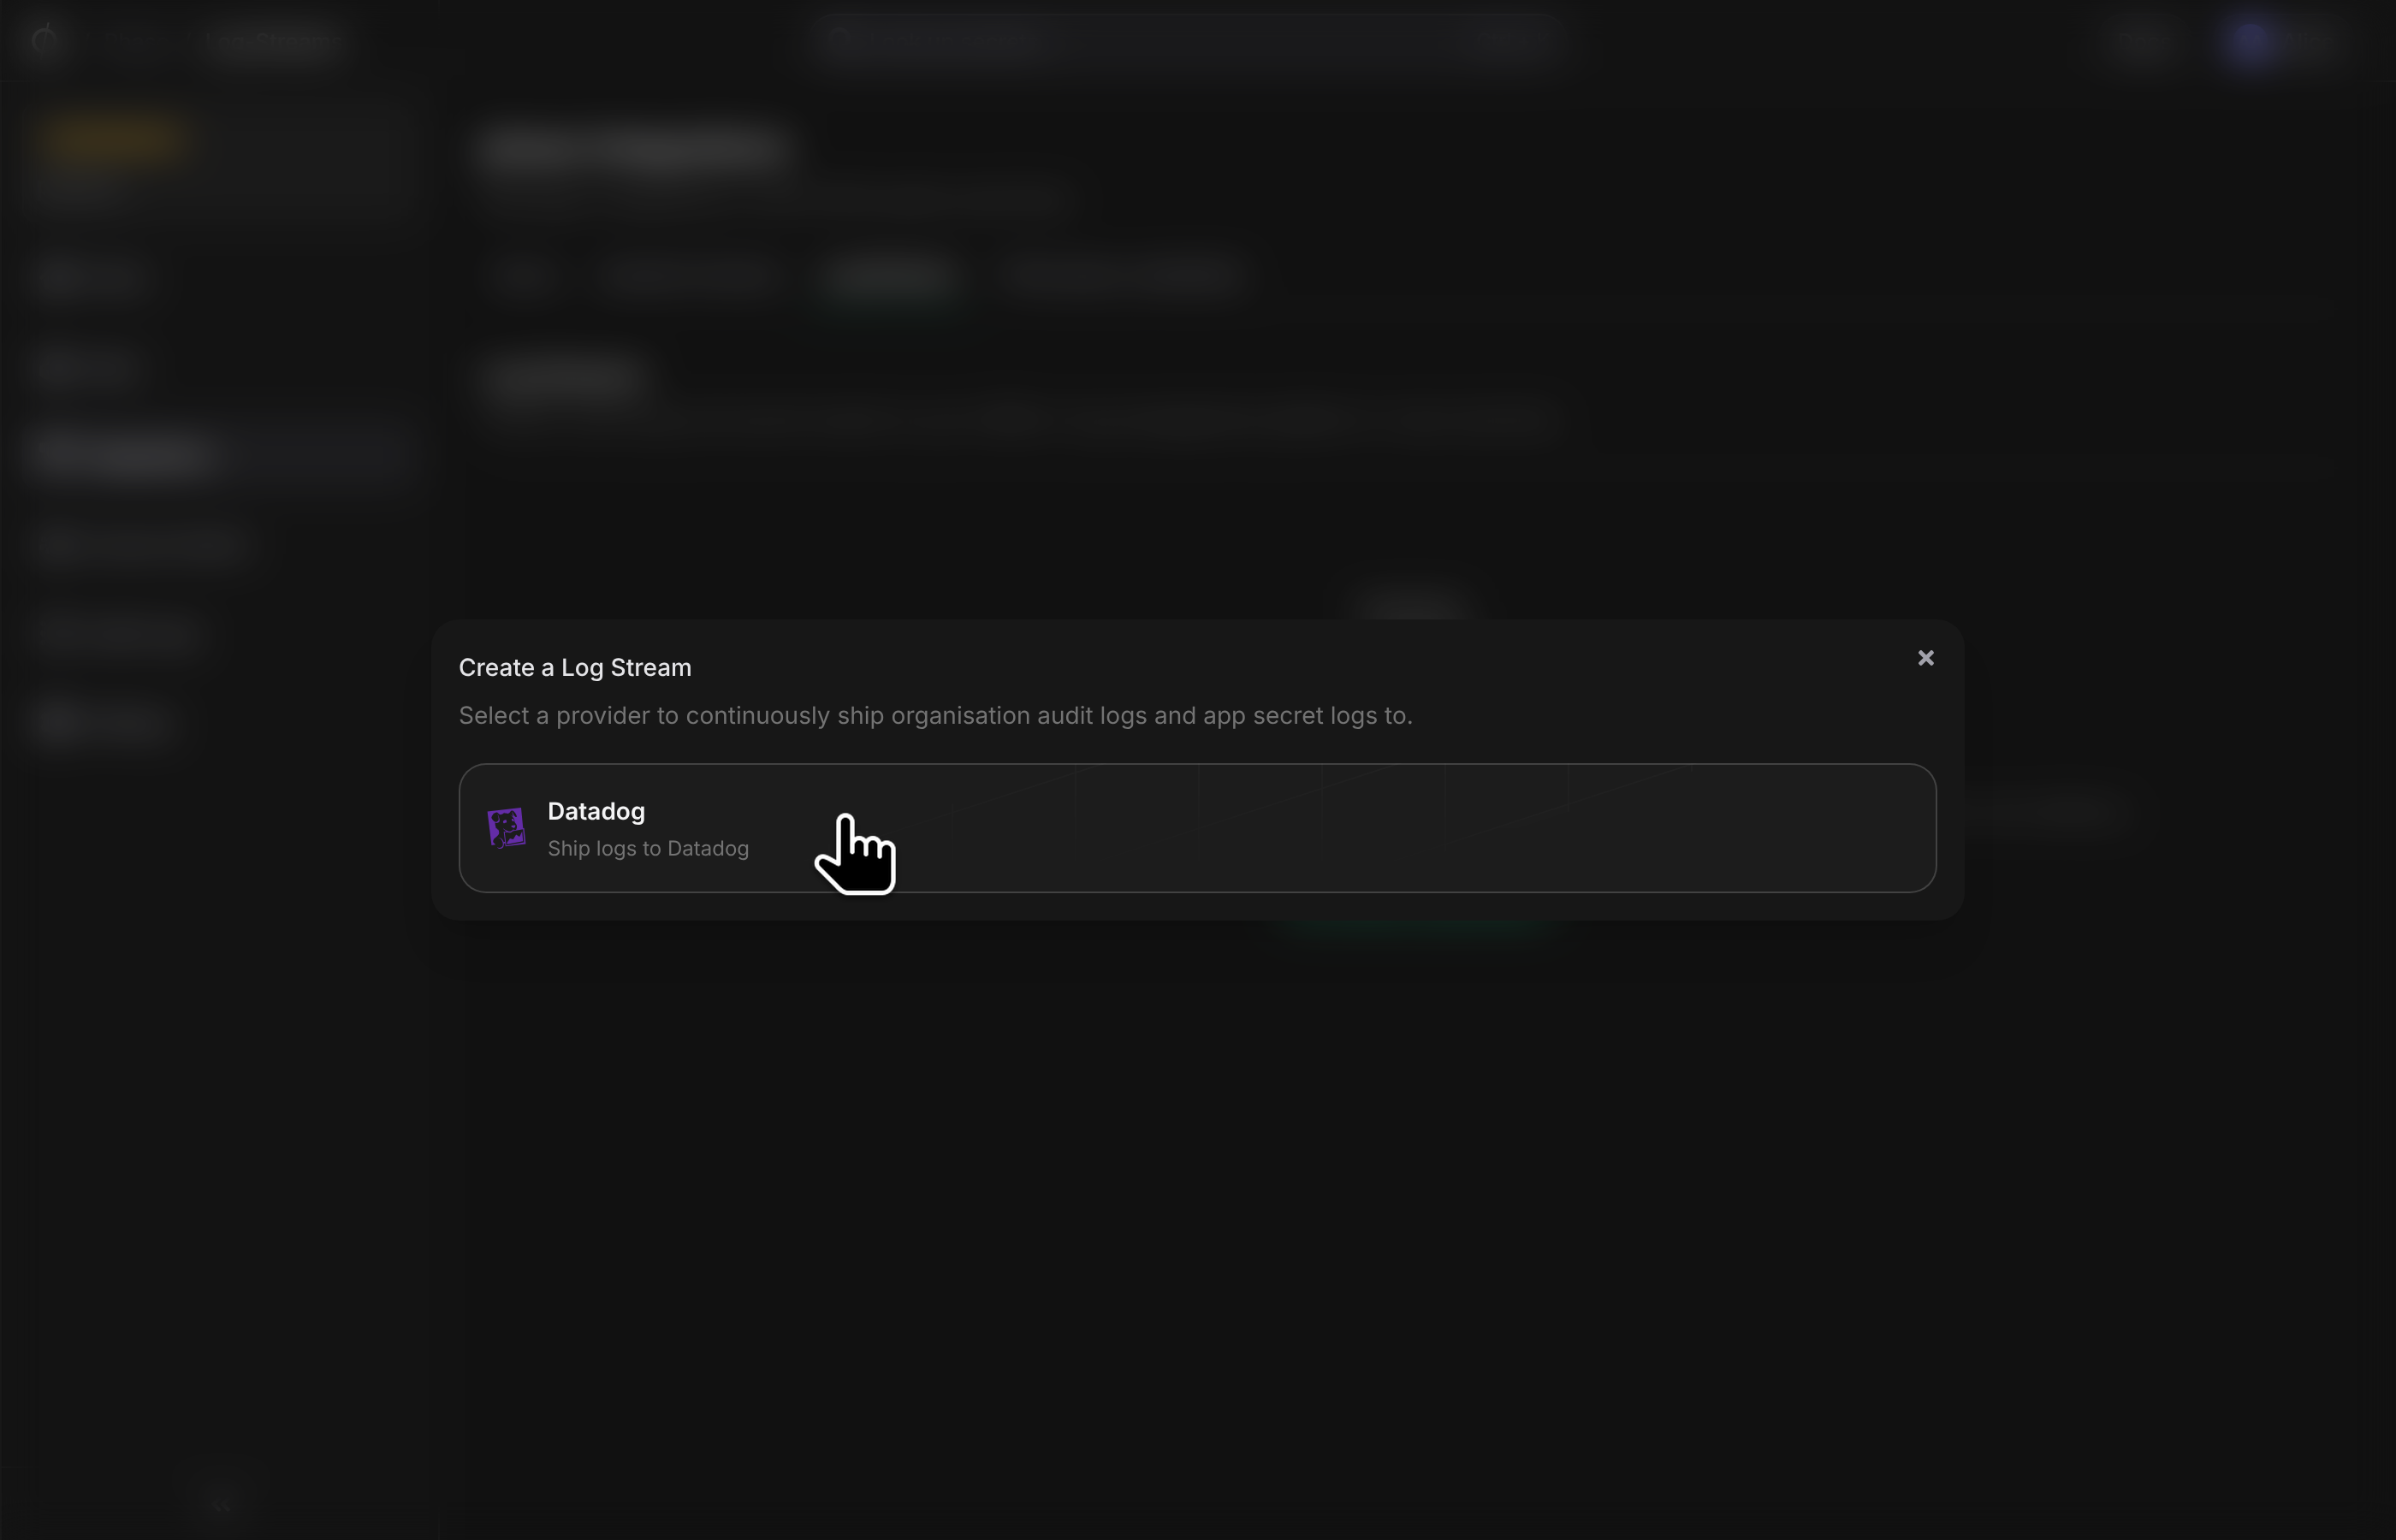
Select Datadog, then your Datadog credentials.
-
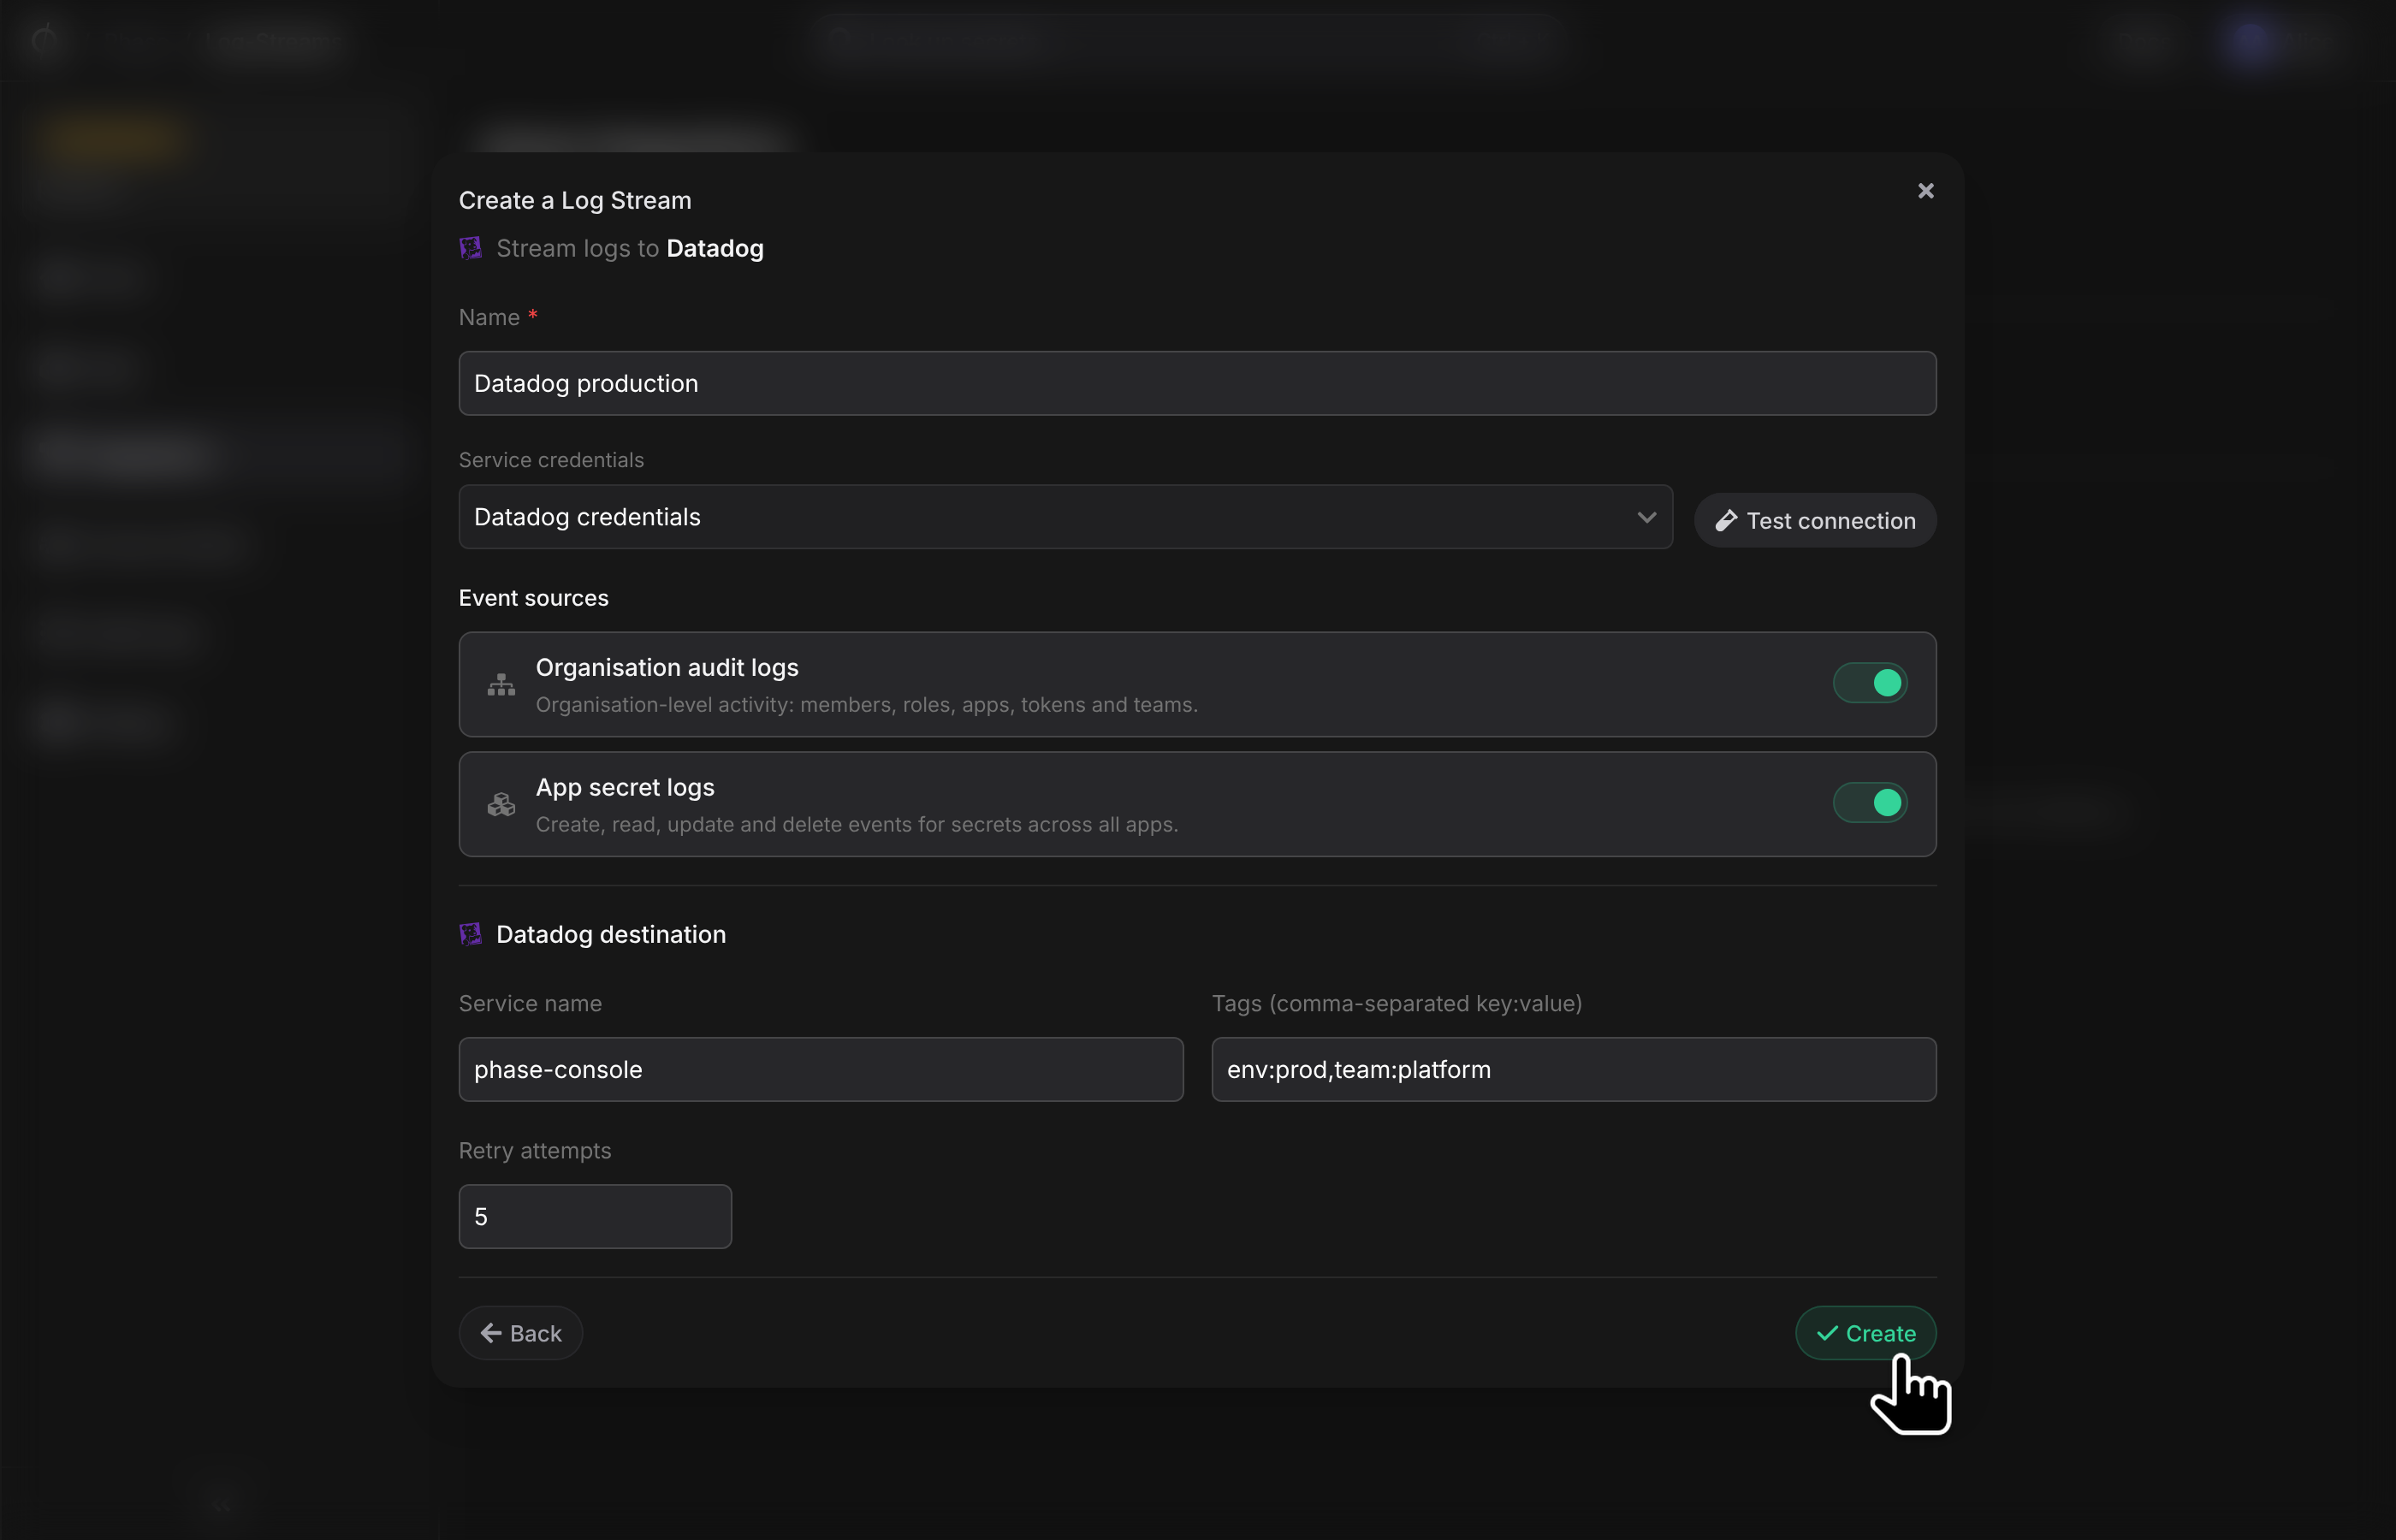
Choose the event sources to ship.
-
Optionally configure the Datadog
servicename, additional tags and the per-chunk retry limit. Tag values are sanitised to Datadog's tag rules (lowercased, spaces and special characters become underscores). -
Click Test connection to validate the API key against Datadog's key-validation endpoint (no log data is written), then Create.
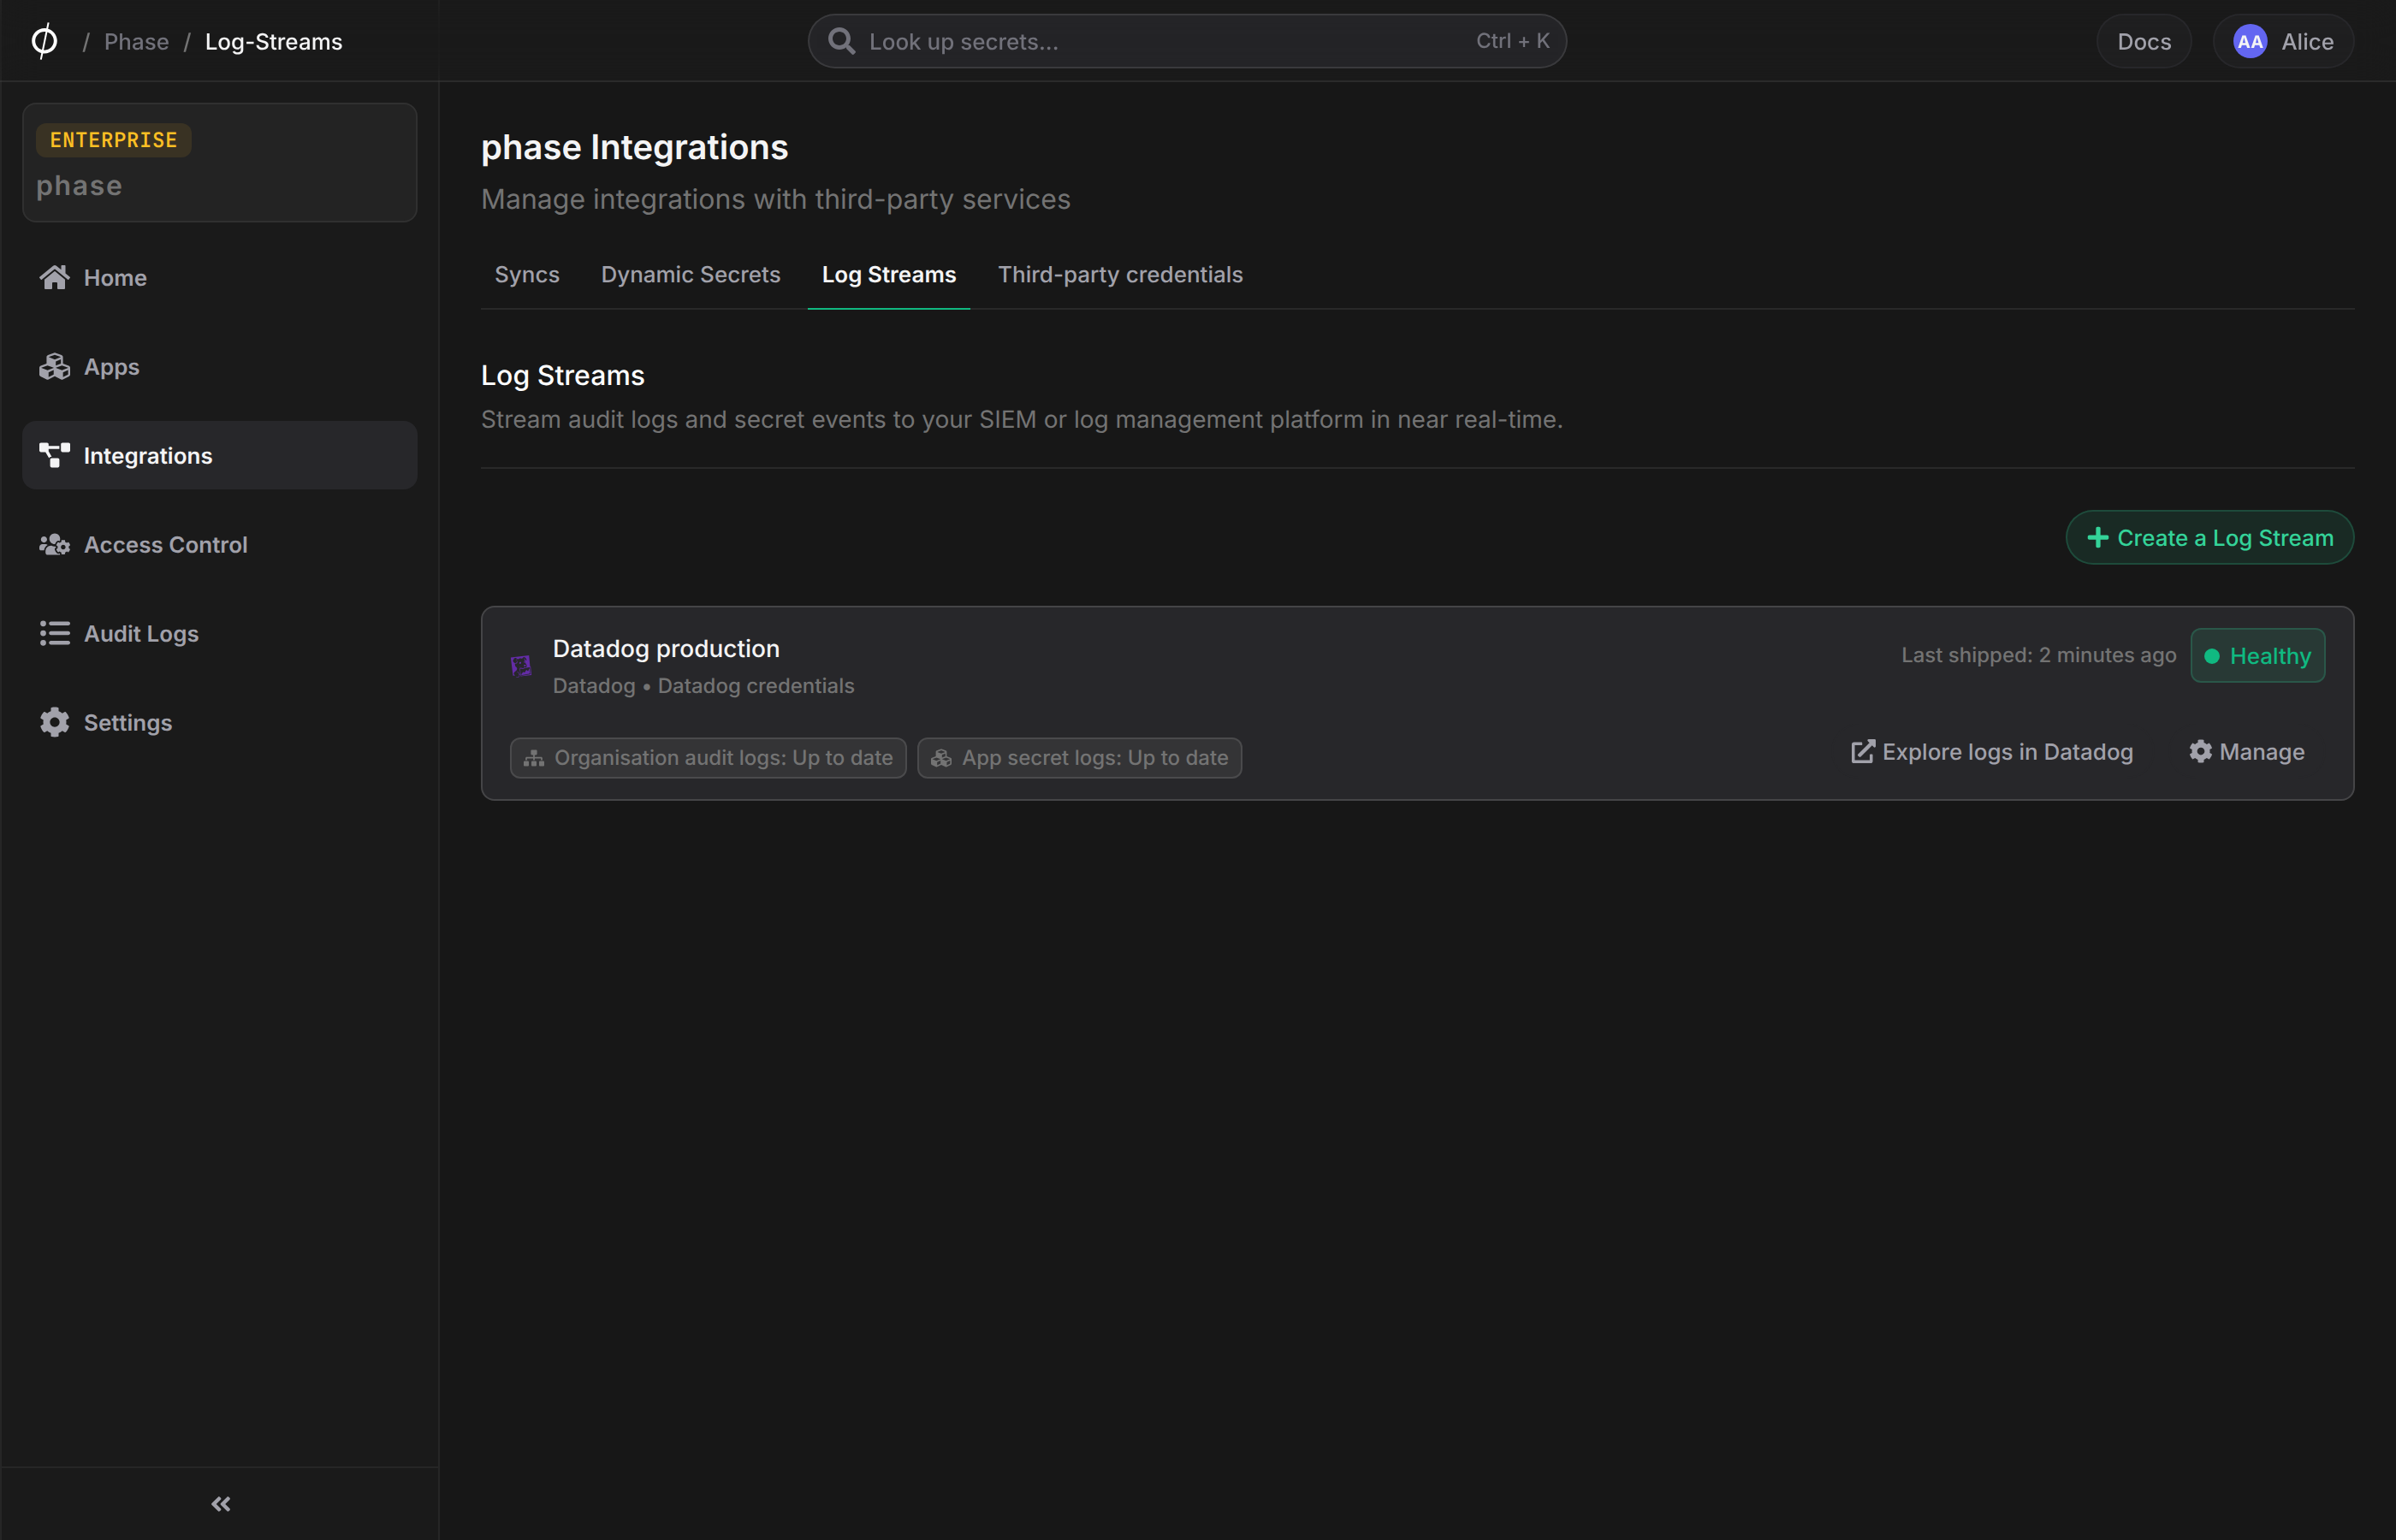
The new stream appears with its health status, per-source delivery state and a deep link to the shipped logs in Datadog:
Events will appear in the Datadog Log Explorer under source:phase within about a minute. Example events as they land in Datadog:
Example events
// A user read a secret via the REST API using curl
{
  "actor": {
    "id": "4b238ce5-f367-4542-b9b9-d839c89e6a33",
    "name": "Nimish", // 👈 User
    "type": "user"
  },
  "event": {
    "category": "secrets",
    "id": "e62e3a35-81c2-4c9b-aec4-08fdf49451a2",
    "type": "read"
  },
  "http": {
    "useragent": "curl/8.7.1"  // 👈 Client User agent
  },
  "network": {
    "client": {
      "ip": "100.18.54.22" // 👈 User IP address
    }
  },
  "phase": {
    "app": {
      "id": "50ed8caa-2643-4c62-887b-1ef7cb8339a8",
      "name": "example-app" // 👈 App name
    },
    "description": "Secret read in example-app / Development by QA Nimish",
    "environment": {
      "id": "029cca04-b79f-4146-867e-dcb089a08c16",
      "name": "Development", // 👈 Environment
      "type": "DEV"
    },
    "organisation": {
      "id": "b081a3bc-4a72-4744-aa9a-b06fcc057ceb",
      "name": "acme"
    },
    "secret": {
      "id": "861456fc-2b80-422f-9221-a9114584e92d", // 👈 You can look this up in Phase Global Search
      "path": "/",
      "type": "SECRET",
      "version": 1
    }
  },
  "schema_version": 1,
  "service": "phase-console",
  "timestamp": "2026-08-03T14:53:51.820499+00:00",
  "usr": {
    "email": "nimish@phase.dev",
    "id": "4b238ce5-f367-4542-b9b9-d839c89e6a33",
    "name": "QA Nimish"
  }
}
Using the logs in Datadog
Since Phase ships structured JSON, every field is parsed automatically. IP addresses, user agents and user identity are mapped to Datadog standard attributes (network.client.ip, http.useragent, usr.*) so they light up native facets with no pipeline configuration. Some useful queries:
# 👇 Filter for secret read events
source:phase @event.category:secrets @event.type:read

# 👇 Filter for organisation audit logs of a specific user
source:phase @usr.email:dev@example.com

# 👇 Filter for logs from a specific client IPv4 network address
source:phase @network.client.ip:203.0.113.7

# 👇 Filter secret logs for the Production environment of my backend application
source:phase @phase.app.name:backend @phase.environment.name:Production
For Cloud SIEM, you can create detection rules over these logs, for example:
- Secret reads from an IP outside your allowed ranges:
source:phase @event.type:read -@network.client.ip:203.0.113.0/24 - A service account token created and used within minutes, or mass secret reads from a single actor in a short window.
Datadog's intake silently discards events with timestamps older than 18 hours. This is why streams cannot backfill historical data from before they were created, and why a stream that is paused or failing for that long records the missed range as skipped in the delivery history and jumps the cursor forward. The engine skips shortly before the 18-hour mark — it keeps a ~40-minute safety margin so events admitted for delivery cannot age past the cutoff mid-flight. The events always remain queryable in Phase: organisation audit events under Logs in the Console, and secret events in each app's Logs tab.
Self-hosting
- Log shipping runs on a dedicated
log-streamsqueue. The bundled worker (python manage.py rqworker) starts a pool for it automatically — size it with theLOG_STREAM_WORKERSenvironment variable (default:2). Shipping is network-bound and serialized per stream, so useful concurrency roughly equals your number of active streams. - If you run split workers (e.g. one Deployment per queue on Kubernetes), add a consumer for the
log-streamsqueue. - See the self-hosting guide and environment variables reference for full deployment configuration.